我正在寻找一种方法来格式化/舍入 GeoPandas 中 .plot() 函数生成的地图中的数字图例标签。例如:
gdf.plot(column='pop2010', scheme='QUANTILES', k=4)
这给我一个带有许多小数位的图例:
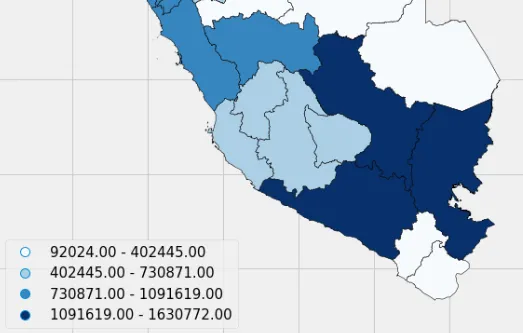
我想要图例标签为整数。
我正在寻找一种方法来格式化/舍入 GeoPandas 中 .plot() 函数生成的地图中的数字图例标签。例如:
gdf.plot(column='pop2010', scheme='QUANTILES', k=4)
这给我一个带有许多小数位的图例:
我想要图例标签为整数。
最近我遇到了同样的问题,但在Stack Overflow或其他网站上没有找到可用的解决方案,所以我想分享一下我的方法,以便对大家有用。
首先,使用geopandas世界地图创建一个基本的绘图:
# load world data set
world_orig = geopandas.read_file(geopandas.datasets.get_path('naturalearth_lowres'))
world = world_orig[(world_orig['pop_est'] > 0) & (world_orig['name'] != "Antarctica")].copy()
world['gdp_per_cap'] = world['gdp_md_est'] / world['pop_est']
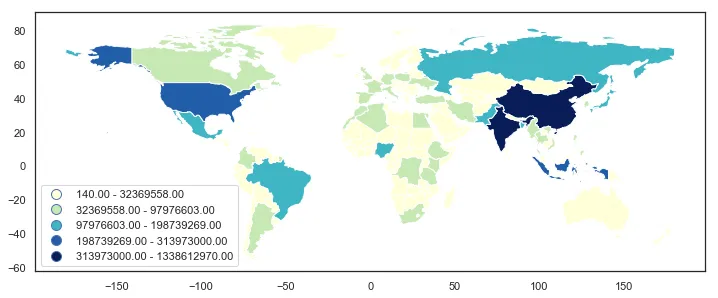
# basic plot
fig = world.plot(column='pop_est', figsize=(12,8), scheme='fisher_jenks',
cmap='YlGnBu', legend=True)
leg = fig.get_legend()
leg._loc = 3
plt.show()
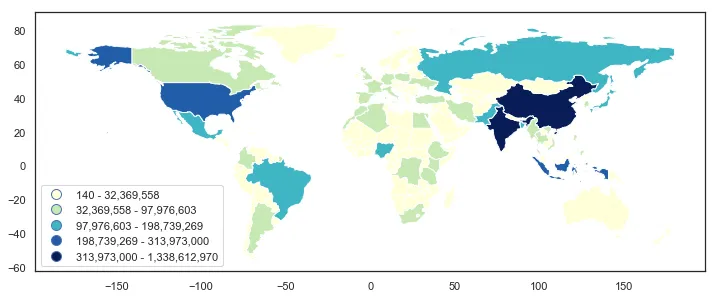
我使用的方法依赖于matplotlib.legend.Legend对象的get_texts()方法,然后迭代leg.get_texts()中的项目,将文本元素拆分为下限和上限,然后创建一个应用了格式的新字符串,并使用set_text()方法设置它。
# formatted legend
fig = world.plot(column='pop_est', figsize=(12,8), scheme='fisher_jenks',
                 cmap='YlGnBu', legend=True)
leg = fig.get_legend()
leg._loc = 3

for lbl in leg.get_texts():
    label_text = lbl.get_text()
    lower = label_text.split()[0]
    upper = label_text.split()[2]
    new_text = f'{float(lower):,.0f} - {float(upper):,.0f}'
    lbl.set_text(new_text)

plt.show()
方法一
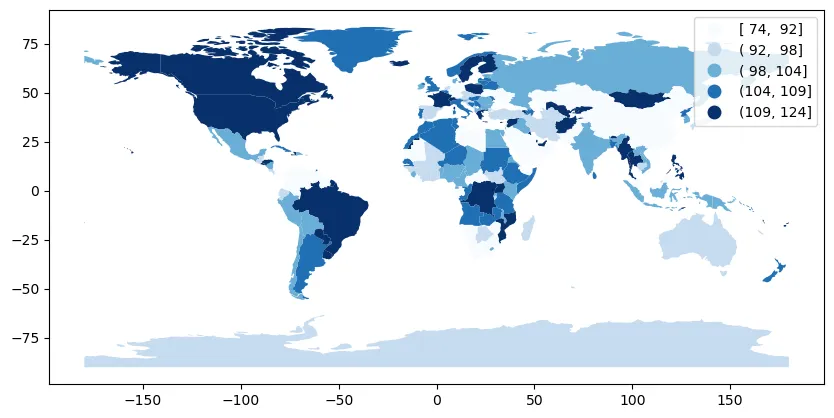
根据geopandas的更新日志,自0.8.0版本(2020年6月24日)以来,您可以在legend_kwds中传递fmt来格式化图例标签。例如,如果您不想要小数点,可以设置fmt='{:.0f}',就像使用f-string格式化数字一样。以下是一个分位数地图的示例:
import matplotlib.pyplot as plt
import numpy as np
import mapclassify
import geopandas as gpd

gdf = gpd.read_file(
    gpd.datasets.get_path('naturalearth_lowres')
)
np.random.seed(0)
gdf = gdf.assign(
    random_col=np.random.normal(100, 10, len(gdf))
)

# plot quantiles map
fig, ax = plt.subplots(figsize=(10, 10))
gdf.plot(
    column='random_col',
    scheme='quantiles', k=5, cmap='Blues',
    legend=True,
    legend_kwds=dict(fmt='{:.0f}', interval=True),
    ax=ax
)
 }}
}}
方法2
事实上,GeoPandas 使用 PySal 的 mapclassify 来计算和生成地图图例。 对于上面的分位数图(k=5),我们可以通过在mapclassify中使用 .Quantiles() 来获取分类。
mapclassify.Quantiles(gdf.random_col, k=5)
mapclassify.classifiers.Quantiles对象:Quantiles
Interval Count
------------------------
[ 74.47, 91.51] | 36
( 91.51, 97.93] | 35
( 97.93, 103.83] | 35
(103.83, 109.50] | 35
(109.50, 123.83] | 36
该对象具有属性bins,它返回一个包含所有类别上限的numpy数组。
array([ 91.51435701,  97.92957441, 103.83406507, 109.49954895,
       123.83144775])
# get all upper bounds
upper_bounds = mapclassify.Quantiles(gdf.random_col, k=5).bins
# insert minimal value in front to get all bounds
bounds = np.insert(upper_bounds, 0, gdf.random_col.min())
# format the numerical legend here
intervals = [
    f'{bounds[i]:.0f}-{bounds[i+1]:.0f}' for i in range(len(bounds)-1)
]

# get all the legend labels
legend_labels = ax.get_legend().get_texts()
# replace the legend labels
for interval, legend_label in zip(intervals, legend_labels):
    legend_label.set_text(interval)
 正如您所看到的,由于我们在较低级别上进行操作,因此我们能够自定义图例标签的外观,例如删除那些括号,但在中间使用“-”。
方法三
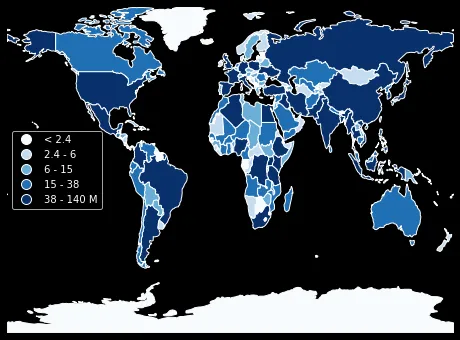
除了GeoPandas的.plot()方法外,您还可以考虑geoplot提供的.choropleth()函数,其中您可以轻松使用不同类型的方案和类数,同时传递legend_labels参数以修改图例标签。例如:
import geopandas as gpd
import geoplot as gplt

gdf = gpd.read_file(
    gpd.datasets.get_path('naturalearth_lowres')
)

legend_labels = [
    '< 2.4', '2.4 - 6', '6 - 15', '15 - 38', '38 - 140 M'
]
gplt.choropleth(
    gdf, hue='pop_est', cmap='Blues', scheme='quantiles',
    legend=True, legend_labels=legend_labels
)
这给了你
fig, ax = plt.subplots(1, 1, figsize=(10,12)),请使用leg = ax.get_legend()而不是leg = fig.get_legend()。 - Alexleg._loc = 3,否则我会得到一个 ValueError:too many values to unpack (expected 2)。但是,使用fig = world.plot(...legend=True, legend_kwds={'loc': 'lower right'})就可以工作了。 - Alex