如何在纵坐标是对数刻度的
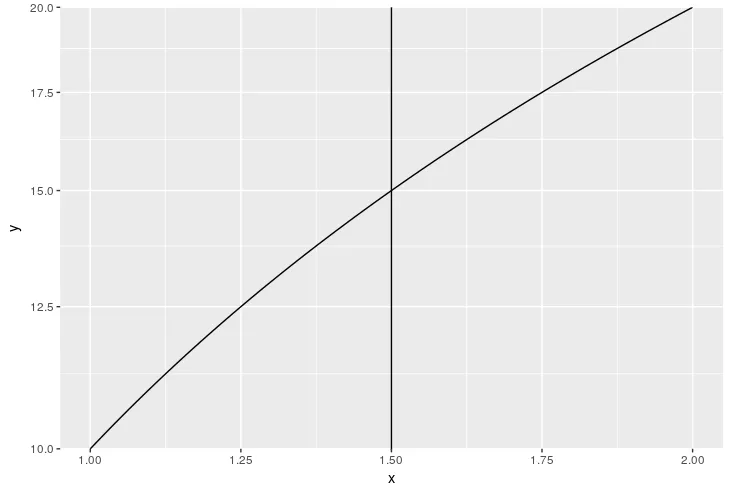
ggplot 图中添加一条垂直线?例如:ggplot(data.frame(x=1:2, y=c(10,20)), aes(x,y)) +
geom_line() +
geom_vline(xintercept = 1.5)
正常情况下,它的工作效果是符合预期的。如果将纵轴转换为对数刻度:
ggplot(data.frame(x=1:2, y=c(10,20)), aes(x,y)) +
  geom_line() +
geom_vline(xintercept = 1.5) +
coord_trans(y = 'log')
然后垂直线就消失了。也许相关的是,如果稍微修改一下数据:
ggplot(data.frame(x=1:2, y=c(1,20)), aes(x,y)) + # y[1] is now different
  geom_line() +
  geom_vline(xintercept = 1.5) +
  coord_trans(y = 'log')
然后垂直线仍然缺失,但会发出警告信息:
Warning messages:
1: In self$trans$y$transform(y) : NaNs produced
2: In trans$transform(value) : NaNs produced
有可能是因为试图对0取对数(得到-Infinity而没有警告)或负数(得到NaN和一个警告)导致了缺失的行。
(sessionInfo() 显示 R版本3.3.1 (2016-06-21) and ggplot2_2.2.0。)