在networkx中将节点分组

7
我有一个涉及图形的可视化问题。我有N个节点,它们属于某些M个网络。这些节点可以具有网络内边缘(在同一网络中)和网络间边缘(从一个网络中的节点到另一个网络中的节点)。

image

当我在
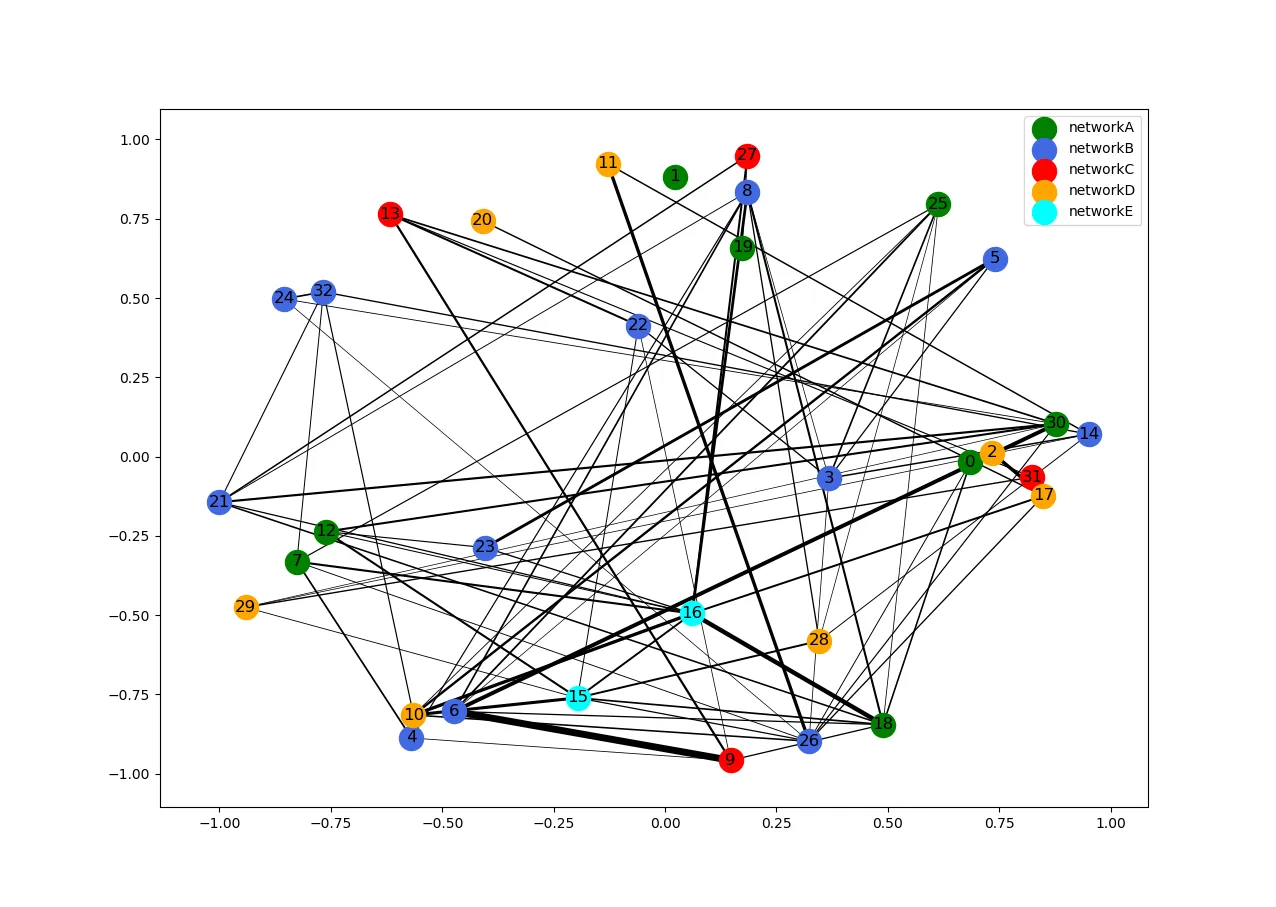
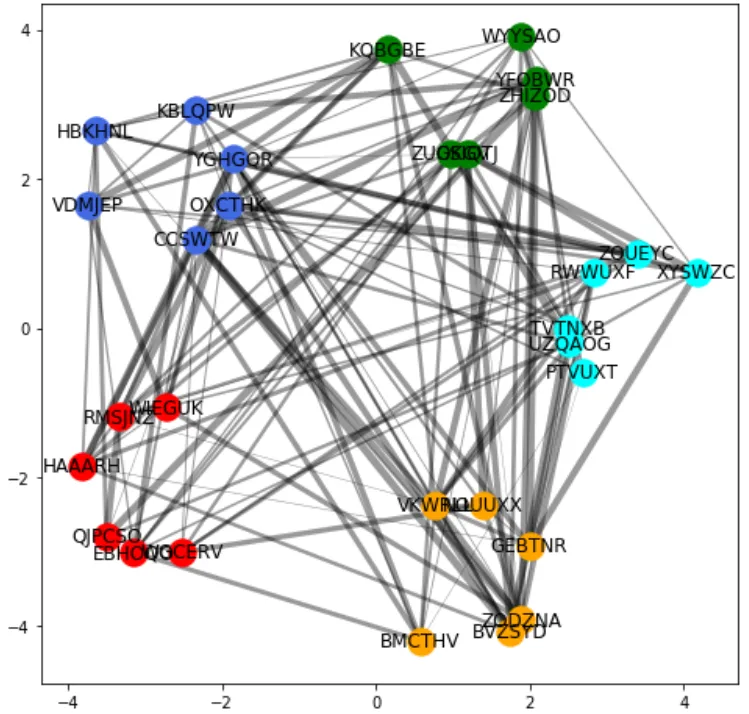
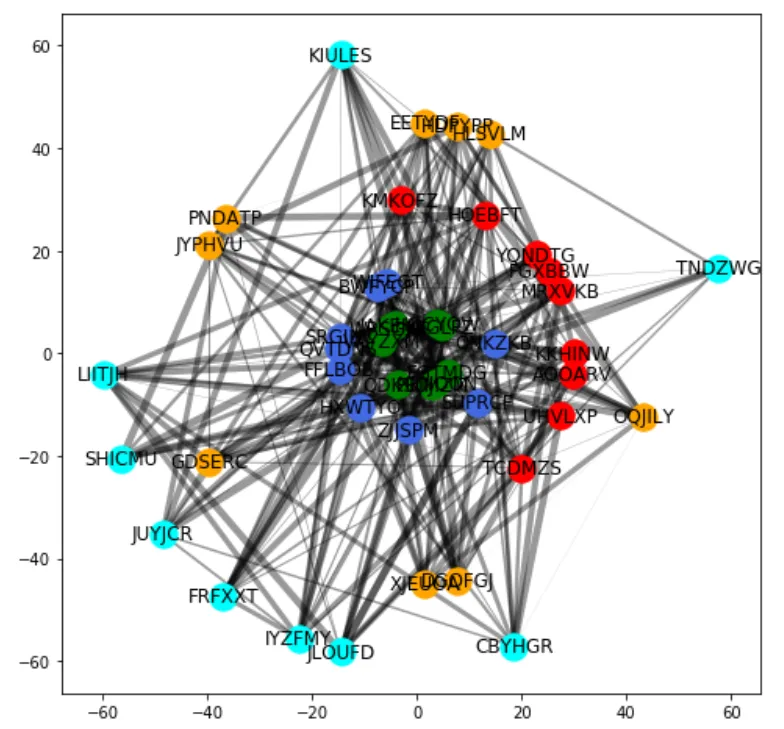
networkx中可视化图形时,我正在寻找一种将网络放置/聚类在一起的方法,以便我可以轻松地识别网络内部/外部的连接。因此,理想情况下,所有蓝色节点将作为网络聚集在一起(没有特定顺序)。同样适用于橙色或绿色节点。
顺便说一句,我不是在寻找枢纽/集群,我知道哪些节点在哪个网络中,我只是试图找到一种更整洁的可视化方式。有没有什么简单的方法可以做到这一点?例如,高级弹簧布局,我可以指定一些节点应该一起显示,而不考虑边缘权重/弹簧力?

最小工作生成器

import string, random
import networkx as nx
import matplotlib.pyplot as plt
from scipy.sparse import random as sparse_random


# Random string generator
def rand_string(size=6, chars=string.ascii_uppercase):
    return ''.join(random.choice(chars) for _ in range(size))


# Set up a nodes and networks randomly
nodes = [rand_string() for _ in range(30)]
networks = [rand_string() for _ in range(5)]
networks_list = networks*6
random.shuffle(networks_list)

# Define what nodes belong to what network and what their color should be
node_network_map = dict(zip(nodes, networks_list))
colors = ['green', 'royalblue', 'red', 'orange', 'cyan']
color_map = dict(zip(networks, colors))

graph = nx.Graph()
graph.add_nodes_from(nodes)
nodes_by_color = {val: [node for node in graph if color_map[node_network_map[node]] == val]
                  for val in colors}

# Take random sparse matrix as adjacency matrix
mat = sparse_random(30, 30, density=0.3).todense()
for row, row_val in enumerate(nodes):
    for col, col_val in enumerate(nodes):
        if col > row and mat[row, col] != 0.0: # Stick to upper half triangle, mat is not symmetric
            graph.add_edge(row_val, col_val, weight=mat[row, col])

# Choose a layout to visualize graph
pos = nx.spring_layout(graph)
edges = graph.edges()

# Get the edge weights and normalize them 
weights = [abs(graph[u][v]['weight']) for u, v in edges]
weights_n = [5*float(i)/max(weights) for i in weights] # Change 5 to control thickness

# First draw the nodes 
plt.figure()
for color, node_names in nodes_by_color.items():
    nx.draw_networkx_nodes(graph, pos=pos, nodelist=node_names, node_color=color)

# Then draw edges with thickness defined by weights_n
nx.draw_networkx_edges(graph, pos=pos, width=weights_n)
nx.draw_networkx_labels(graph, pos=pos)
plt.show()

如果不知道您如何定义整个网络及其子网络,那么很难为您提供帮助。因此,请至少提供您代码的一部分。 - sentence
@sentence 根据要求添加。 - ITA
1个回答

3
为了获得更好的节点布局,我首先使用圆形布局(替换您的弹簧布局)。然后,我将每组节点移动到更大圆周上的新位置。
# --- Begin_myhack ---
# All this code should replace original `pos=nx.spring_layout(graph)`
import numpy as np
pos = nx.circular_layout(graph)   # replaces your original pos=...
# prep center points (along circle perimeter) for the clusters
angs = np.linspace(0, 2*np.pi, 1+len(colors))
repos = []
rad = 3.5     # radius of circle
for ea in angs:
    if ea > 0:
        #print(rad*np.cos(ea), rad*np.sin(ea))  # location of each cluster
        repos.append(np.array([rad*np.cos(ea), rad*np.sin(ea)]))
for ea in pos.keys():
    #color = 'black'
    posx = 0
    if ea in nodes_by_color['green']:
        #color = 'green'
        posx = 0
    elif ea in nodes_by_color['royalblue']:
        #color = 'royalblue'
        posx = 1
    elif ea in nodes_by_color['red']:
        #color = 'red'
        posx = 2
    elif ea in nodes_by_color['orange']:
        #color = 'orange'
        posx = 3
    elif ea in nodes_by_color['cyan']:
        #color = 'cyan'
        posx = 4
    else:
        pass
    #print(ea, pos[ea], pos[ea]+repos[posx], color, posx)
    pos[ea] += repos[posx]
# --- End_myhack ---

输出的图表将类似于以下内容:

enter image description here

编辑

通常,在所有情况下并不存在最佳布局。因此,我提供第二种解决方案,它使用同心圆来分隔节点的各个单独组。以下是相关代码及其样本输出。

# --- Begin_my_hack ---
# All this code should replace original `pos=nx.spring_layout(graph)`
import numpy as np
pos = nx.circular_layout(graph)
radii = [7,15,30,45,60]  # for concentric circles

for ea in pos.keys():
    new_r = 1
    if ea in nodes_by_color['green']:
        new_r = radii[0]
    elif ea in nodes_by_color['royalblue']:
        new_r = radii[1]
    elif ea in nodes_by_color['red']:
        new_r = radii[2]
    elif ea in nodes_by_color['orange']:
        new_r = radii[3]
    elif ea in nodes_by_color['cyan']:
        new_r = radii[4]
    else:
        pass
    pos[ea] *= new_r   # reposition nodes as concentric circles
# --- End_my_hack ---

fig2


谢谢。这看起来是一个不错的起点。如果所有的代码都应该替换对 nx.spring_layout 的调用,那么上面的代码中使用的是 color 变量吗?例如 color='black'color='green' 等等。 - ITA
“color”变量用于调试期间的“print()”。它可以完全省略,而不会对图形产生任何影响。 - swatchai

网页内容由stack overflow 提供, 点击上面的
可以查看英文原文,
原文链接