我正在尝试使我在点之间绘制的路径更加平滑。
请考虑以下事项:
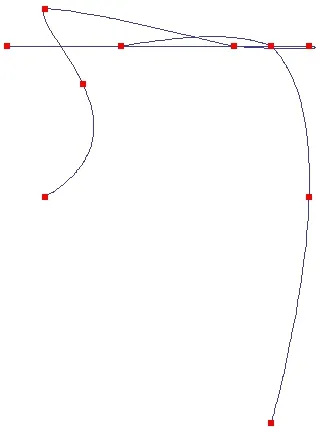
 lesPoints = {{41, 26}, {42, 29}, {41, 31}, {46, 30}, {48, 30},
              {40, 30}, {43, 30}, {47, 30}, {48, 26}, {47, 20}}
这些是我用来追踪时间路径的真实眼睛固定坐标。
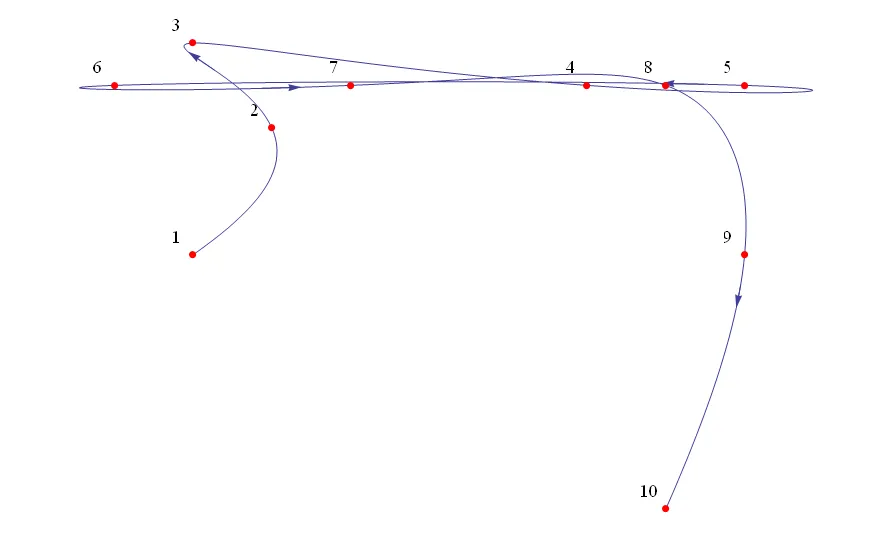
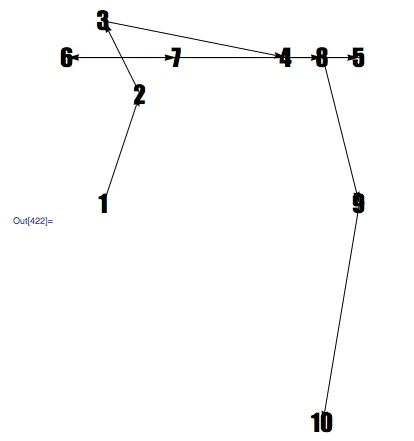
现在我绘制它们的方式如下:
Graphics[{
         Table[Arrow[{lesPoints[[i]], lesPoints[[i + 1]]}],
              {i,Length[lesPoints] - 1}],
         MapThread[Text[Style[#1, Large, FontFamily -> "Impact"], {#2, #3}] &,
         PrependTo[Transpose[lesPoints], Range[1, Length@lesPoints]]]}]
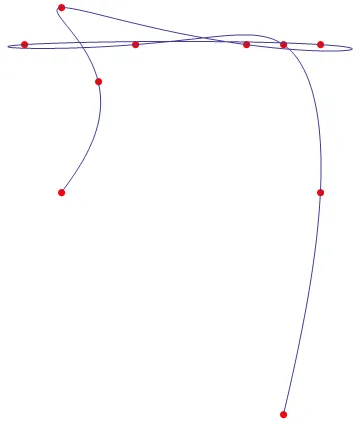
我在尝试使用插值时无法成功。
如果要平滑路径,是否有其他替代方法?