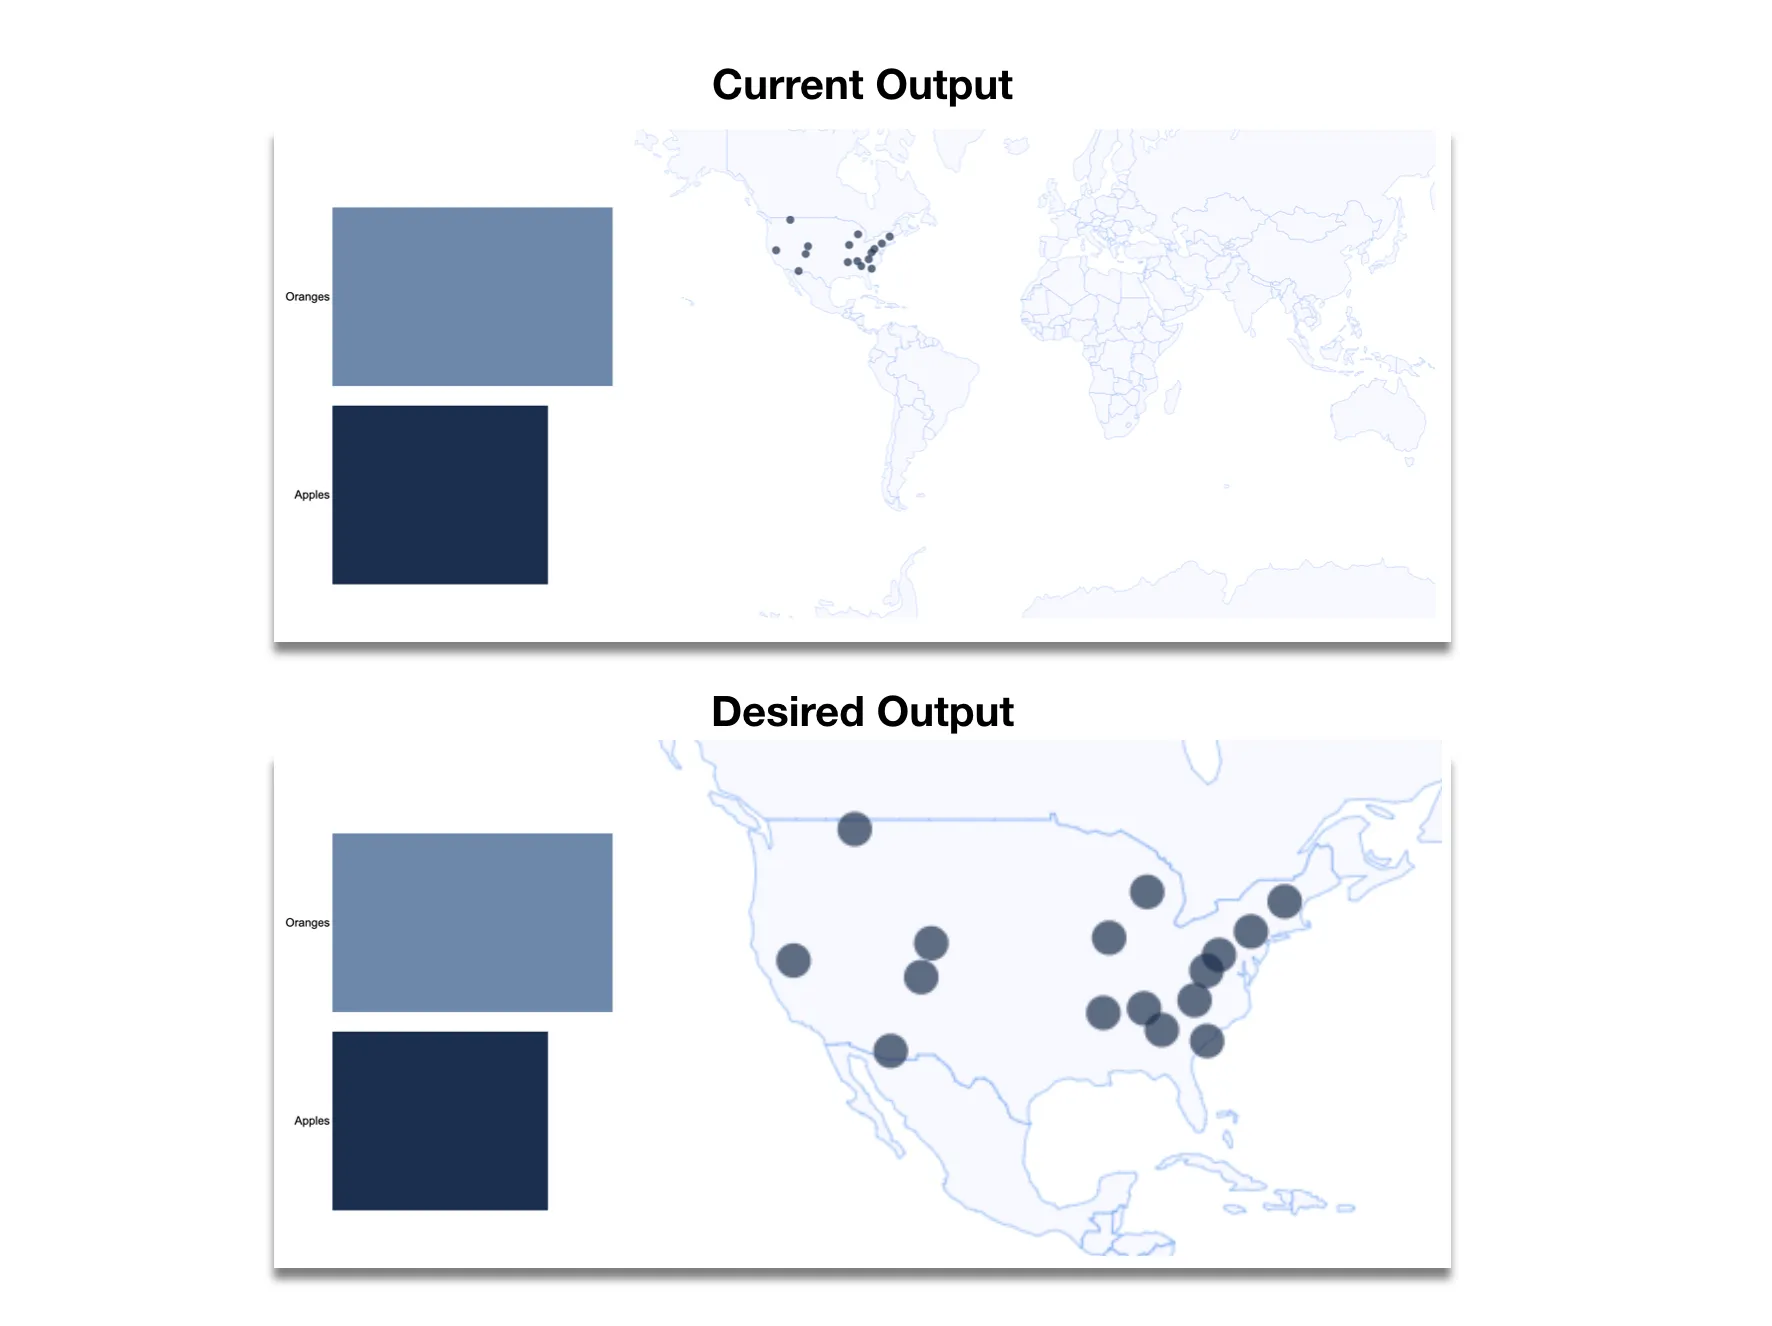
我对D3还不是很熟悉,如果这与其他帖子重复了,我很抱歉。我试图制作一张地图,其中包含用户通过单击条形图选择的点。目前,我有一个世界地图,并且根据点击的条形图,点进入和退出。我想知道如何添加缩放效果,将地球仅裁剪为所选条形区域的点区域。例如:第一个条应导致美国的地图。
        var data = [{
                "name": "Apples",
                "value": 20,
                "latlong": [
  {"latitude": 32.043478, "longitude": -110.7851017},
  {"latitude": 40.49, "longitude": -106.83},
  {"latitude": 39.1960652, "longitude": -120.2384172},
  {"latitude": 36.137076, "longitude": -81.183722},
  {"latitude": 35.1380976, "longitude": -90.0611644},
  {"latitude": 33.76875, "longitude": -84.376217},
  {"latitude": 32.867153, "longitude": -79.9678813},
  {"latitude": 39.61078, "longitude": -78.79830099999},
  {"latitude": 40.8925, "longitude": -89.5074},
  {"latitude": 44.1862, "longitude": -85.8031},
  {"latitude": 35.48759154, "longitude": -86.10236359},
  {"latitude": 37.9342807, "longitude": -107.8073787999},
  {"latitude": 41.3530864, "longitude": -75.6848074},
  {"latitude": 38.423137, "longitude": -80.021118},
  {"latitude": 43.5121, "longitude": -72.4021},
  {"latitude": 48.4070083, "longitude": -114.2827366}
  ]
        },
            {
                "name": "Oranges",
                "value": 26,
                "latlong": [
                  {"latitude": -36.8506158, "longitude": 174.7678785},
  {"latitude": -27.4510454, "longitude": 153.0319808},
  {"latitude": -33.867111, "longitude": 151.217941},
  {"latitude": -34.8450381, "longitude": 138.4985548},
  {"latitude": -37.7928386, "longitude": 144.9051327},
  {"latitude": -32.0582947, "longitude": 115.7460244},
  {"latitude": 29.934926599999, "longitude": -90.0615085},
  {"latitude": -34.4829472, "longitude": -58.518548},
  {"latitude": -33.460464, "longitude": -70.656868},
  {"latitude": 4.8007362, "longitude": -74.0373992},
  {"latitude": 4.9375556, "longitude": -73.9649426},
  {"latitude": -23.701185, "longitude": -46.7001431},
  {"latitude": 33.678023, "longitude": -116.23754},
  {"latitude": 51.8451208, "longitude": 5.6872547},
  {"latitude": 40.3688321, "longitude": -3.6866294},
  {"latitude": 40.4817271, "longitude": -3.6330802},
  {"latitude": 40.4642, "longitude": -3.6131},
  {"latitude": 52.327353537, "longitude": 1.67658117421},
                ]
        }
        ];

        //set up svg using margin conventions - we'll need plenty of room on the left for labels
        var margin = {
            top: 15,
            right: 25,
            bottom: 15,
            left: 60
        };

        var width = 400 - margin.left - margin.right,
            height = 500 - margin.top - margin.bottom;

        var svg = d3.select("#graphic").append("svg")
            .attr("width", width + margin.left + margin.right)
            .attr("height", height + margin.top + margin.bottom)
            .append("g")
            .attr("transform", "translate(" + margin.left + "," + margin.top + ")");

        var x = d3.scale.linear()
            .range([0, width])
            .domain([0, d3.max(data, function (d) {
                return d.value;
            })]);

        var y = d3.scale.ordinal()
            .rangeRoundBands([height, 0], .1)
            .domain(data.map(function (d) {
                return d.name;
            }));

        //make y axis to show bar names
        var yAxis = d3.svg.axis()
            .scale(y)
            //no tick marks
            .tickSize(0)
            .orient("left");

        var gy = svg.append("g")
            .attr("class", "y axis")
            .call(yAxis)

        var bars = svg.selectAll(".bar")
            .data(data)
            .enter()
            .append("g")

        //append rects
        bars.append("rect")
            .attr("class", "bar")
            .attr("y", function (d) {
                return y(d.name);
            })
            .attr("height", y.rangeBand())
            .attr("x", 0)
            .attr("width", function (d) {
                return x(d.value);
            })
      .on("click", function (d) {
      // d3.select("#chart circle")
      // .attr("fill", function () { return "rgb(0, 0, " + Math.round(d.key * 10) + ")"; });
      d3.selectAll('rect').style('fill', '#5f89ad');
      d3.select(this).style("fill", "#012B4E");

    var circle =  svg_map.select("g").selectAll("circle")
         .data(d.latlong);
         circle.exit().remove();//remove unneeded circles
         circle.enter().append("circle")
         .attr("r",0);//create any new circles needed
         //update all circles to new positions
         circle.transition()
         .duration(500)
         .attr("cx", function(d){ return projection([d.longitude, d.latitude])[0] })
        .attr("cy", function(d){ return projection([d.longitude, d.latitude])[1] })
        .attr("r", 7)
        .attr("class", "circle")
        .style("fill", "#012B4E")
        .attr("stroke", "#012B4E")
        .style("opacity", 0.7)
        .attr("r", 4)
      })


/////////////////////// WORLD MAP ////////////////////////////

      var width = window.innerWidth,
    height = window.innerHeight,
    centered,
    clicked_point;

var projection = d3.geoMercator()
   // .translate([width / 2.2, height / 1.5]);

var plane_path = d3.geoPath()
        .projection(projection);

var svg_map = d3.select("#graphic").append("svg")
    .attr("width", 900)
    .attr("height", 550)
    .attr("class", "map");

var g = svg_map.append("g");
var path = d3.geoPath()
    .projection(projection);

// load and display the World
d3.json("https://unpkg.com/world-atlas@1/world/110m.json", function(error, topology) {
    g.selectAll("path")
      .data(topojson.feature(topology, topology.objects.countries)
          .features)
      .enter()
      .append("path")
      .attr("d", path)
      ;
 });
path {
stroke: #2296F3;
stroke-width: 0.25px;
fill: #f8f8ff;
}
body {
font-family: "Arial", sans-serif;
}
.bar {
fill: #5f89ad;
}
.axis {
font-size: 13px;
}
.axis path,
.axis line {
fill: none;
display: none;
}
.label {
font-size: 13px;
}<!DOCTYPE html>
<html>
<head>
<meta charset='utf-8' />
<title>Simple Bar chart</title>
<script src="https://cdnjs.cloudflare.com/ajax/libs/d3/3.4.13/d3.js"></script>
<script src="https://unpkg.com/topojson-client@3"></script>
<script src="https://unpkg.com/topojson-client@3"></script>
<script src="https://d3js.org/d3-array.v1.min.js"></script>
<script src="https://d3js.org/d3-geo.v1.min.js"></script>
<script src="https://d3js.org/d3-geo-projection.v2.min.js"></script>
</head>
<body>
<div id="graphic"></div>
</body>
</html>