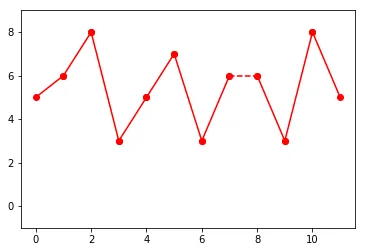
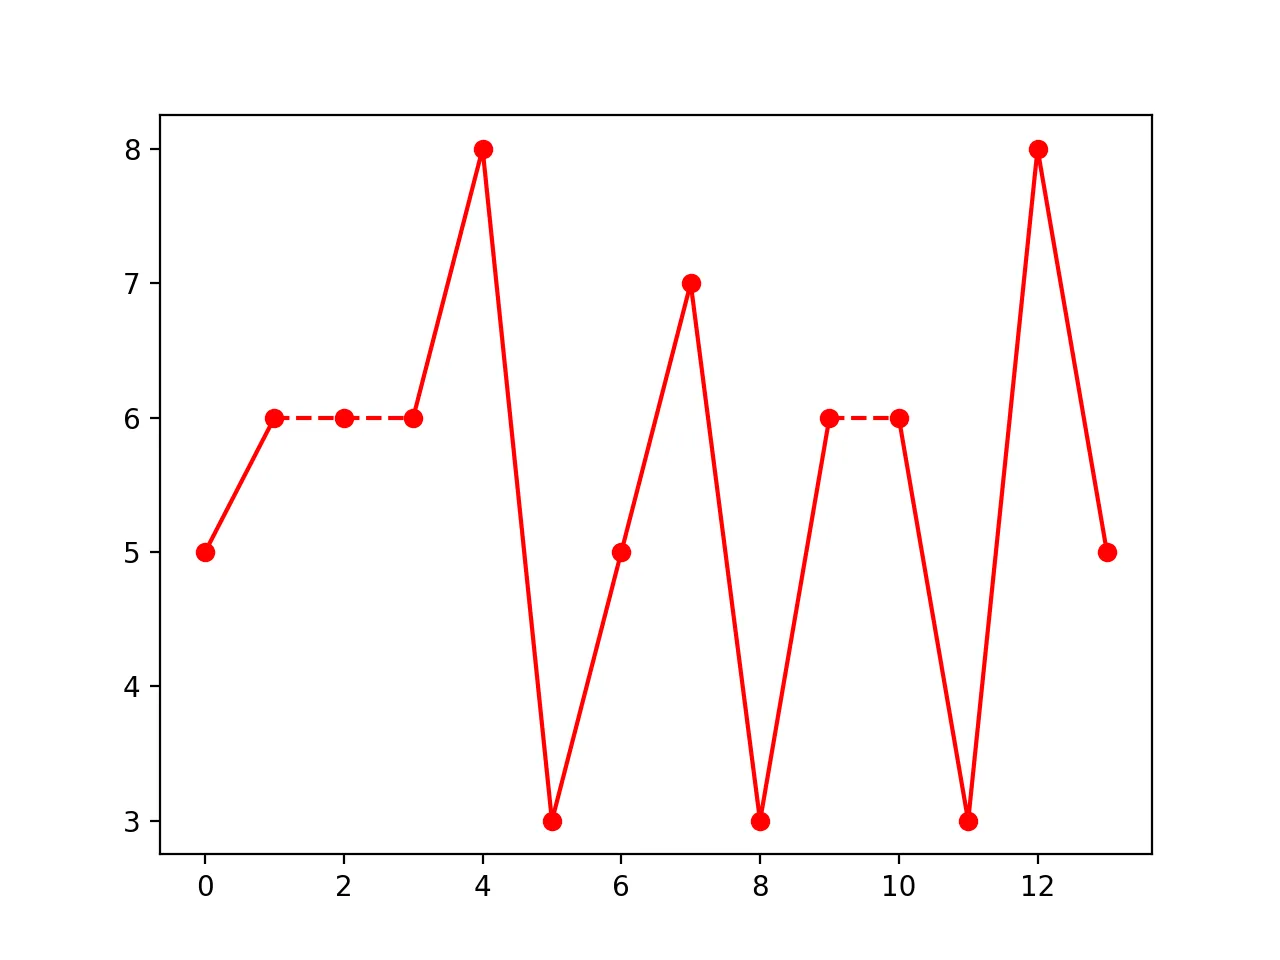
我希望将图表中函数下降到“-1”的部分替换为虚线,延续前一个点的线条(请参见下面的图表)。
以下是我编写的一些代码及其输出:
以下是我编写的一些代码及其输出:
import numpy as np

import matplotlib.pyplot as plt
y = [5,6,8,3,5,7,3,6,-1,3,8,5]

plt.plot(np.linspace(1,12,12),y,'r-o')
plt.show()

for i in range(1,len(y)):
    if y[i]!=-1:
        plt.plot(np.linspace(i-1,i,2),y[i-1:i+1],'r-o')
    else:
        y[i]=y[i-1]
        plt.plot(np.linspace(i-1,i,2),y[i-1:i+1],'r--o')
plt.ylim(-1,9)
plt.show()
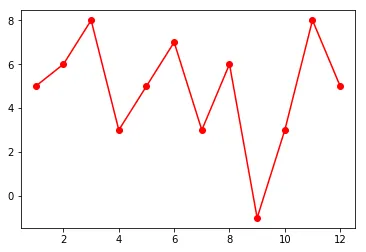
这是原始情节:
修改后的情节:
我编写的代码可以工作(它产生了所需的输出),但在实际运行时效率低下,处理我的(更大的)数据集需要很长时间。有没有更聪明的方法来做到这一点?
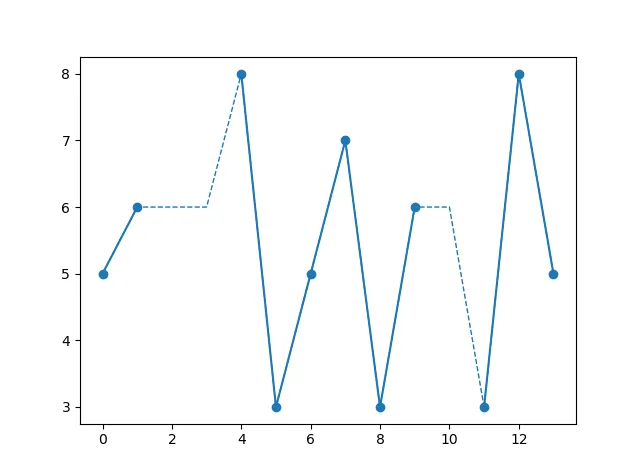
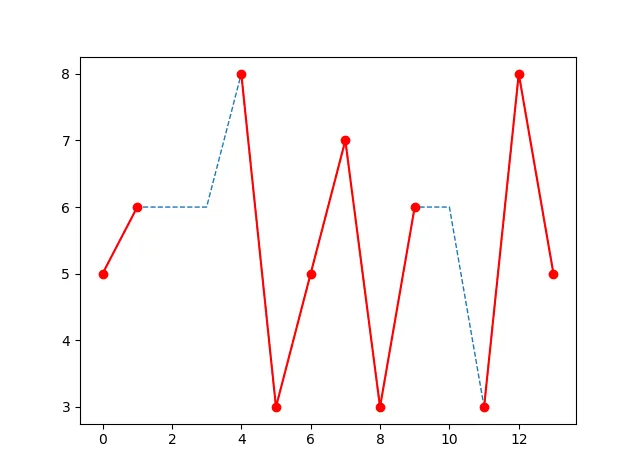
y_masked = np.ma.masked_where(y == -1, y)。绘制这个图表会忽略-1值,因此您仍然需要做一些工作来显示先前的值并添加虚线(也许只绘制掩码值)。 - Ed Smith