使用DBSCAN算法时图像无法正确分割

8

我正在尝试使用scikitlearn中的DBSCAN根据颜色对图像进行分割。结果如下plot of image
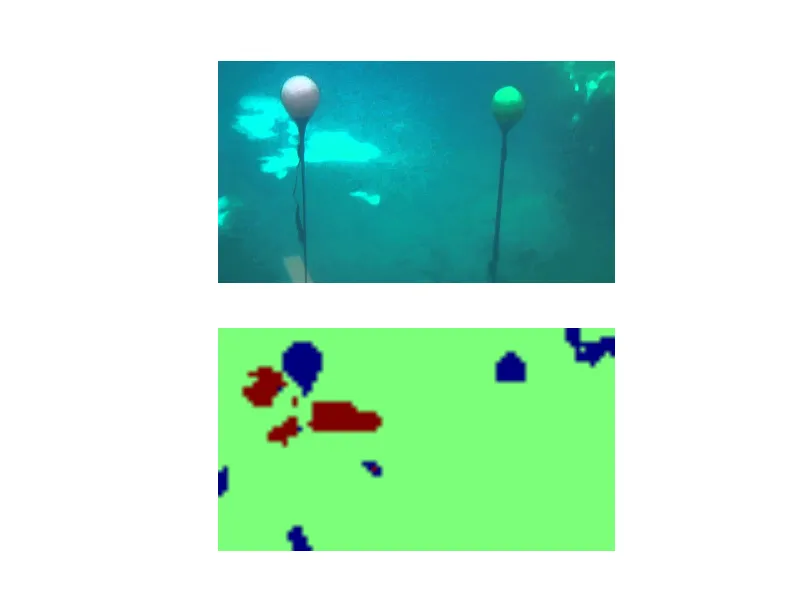
。可以看到有3个聚类。我的目标是将图片中的浮标分离到不同的簇中。但很明显它们都被归为同一簇。我已经尝试了各种eps值和min_samples,但这两个参数总是聚集在一起。我的代码如下:

img= cv2.imread("buoy1.jpg) 
labimg = cv2.cvtColor(img, cv2.COLOR_BGR2LAB)

n = 0
while(n<4):
    labimg = cv2.pyrDown(labimg)
    n = n+1

feature_image=np.reshape(labimg, [-1, 3])
rows, cols, chs = labimg.shape

db = DBSCAN(eps=5, min_samples=50, metric = 'euclidean',algorithm ='auto')
db.fit(feature_image)
labels = db.labels_

plt.figure(2)
plt.subplot(2, 1, 1)
plt.imshow(img)
plt.axis('off')
plt.subplot(2, 1, 2)
plt.imshow(np.reshape(labels, [rows, cols]))
plt.axis('off')
plt.show()

我猜测这是计算欧几里得距离,由于它在lab空间中,不同颜色之间的欧几里得距离将会不同。如果有人能给我指导,我会非常感激。

更新: 下面的答案可行。由于DBSCAN需要一个最多只有2个维度的数组,我将列连接到原始图像上并重塑为一个n x 5矩阵,其中n是x维度乘以y维度。这对我有效。

indices = np.dstack(np.indices(img.shape[:2]))
xycolors = np.concatenate((img, indices), axis=-1) 
np.reshape(xycolors, [-1,5])

请问您能否在答案中添加完整的代码?我无法理解您是在哪里添加了那三行代码,这对我很有帮助。 - user8306074
2个回答

5

你需要同时使用颜色和位置。

现在,你只使用了颜色。


你能详细说明一下你的答案吗?为什么颜色不够用呢? - Hello Lili
因为您对像素形成区域感兴趣,否则可能会得到嘈杂的结果。 - Has QUIT--Anony-Mousse

5
请问您能否在回答中添加完整的代码?我不太明白您是在哪里添加了那三行代码,它们对您有用。 - user8306074 Sep 4 at 8:58
让我为您解答,并提供完整版本的代码:
import numpy as np
import cv2
import matplotlib.pyplot as plt
from sklearn.cluster import DBSCAN

img= cv2.imread('your image') 
labimg = cv2.cvtColor(img, cv2.COLOR_BGR2LAB)

n = 0
while(n<4):
    labimg = cv2.pyrDown(labimg)
    n = n+1

feature_image=np.reshape(labimg, [-1, 3])
rows, cols, chs = labimg.shape

db = DBSCAN(eps=5, min_samples=50, metric = 'euclidean',algorithm ='auto')
db.fit(feature_image)
labels = db.labels_

indices = np.dstack(np.indices(labimg.shape[:2]))
xycolors = np.concatenate((labimg, indices), axis=-1) 
feature_image2 = np.reshape(xycolors, [-1,5])
db.fit(feature_image2)
labels2 = db.labels_

plt.figure(2)
plt.subplot(2, 1, 1)
plt.imshow(img)
plt.axis('off')

# plt.subplot(2, 1, 2)
# plt.imshow(np.reshape(labels, [rows, cols]))
# plt.axis('off')

plt.subplot(2, 1, 2)
plt.imshow(np.reshape(labels2, [rows, cols]))
plt.axis('off')
plt.show()

网页内容由stack overflow 提供, 点击上面的
可以查看英文原文,
原文链接