我有两个GIS图层 -- 分别称为
叠加操作的结果应该是一个新的SPDF,其中:
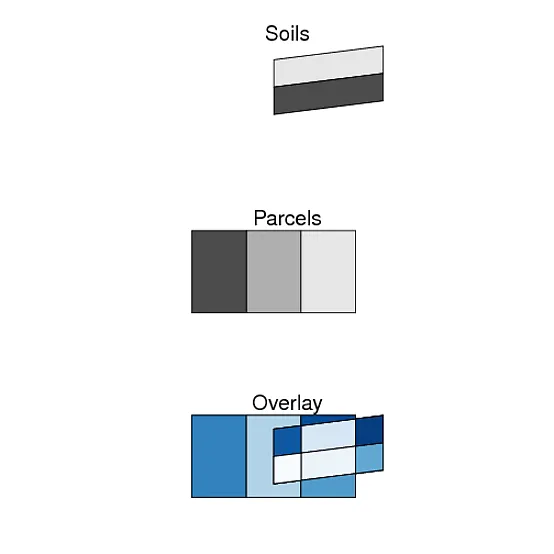
Soils和Parcels -- 存储为SpatialPolygonsDataFrame(SPDF),我想要"叠加"它们,如此处所述。叠加操作的结果应该是一个新的SPDF,其中:
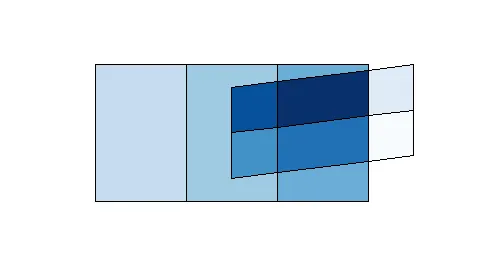
SpatialPolygons组件包含由两个图层交集形成的多边形。(想象一下在投影仪上重叠两个mylar时形成的所有原子多边形)。data.frame组件记录每个原子多边形所在的Soils和Parcels多边形的属性。
SpatialPolygons组件的函数,计算从两个图层相交形成的原子多边形。)我觉得rgeos应该至少有一个可以实现(1)的函数,但似乎并没有... 这里是一张图,可能有助于更清楚地理解我想要的内容,接下来是创建在图中显示的Soils和Parcels图层的代码。
library(rgeos)

## Just a utility function to construct the example layers.
flattenSpatialPolygons <- function(SP) {
    nm <- deparse(substitute(SP))
    AA <- unlist(lapply(SP@polygons, function(X) X@Polygons))
    SpatialPolygons(lapply(seq_along(AA),
                           function(X) Polygons(AA[X], ID=paste0(nm, X))))
}

## Example Soils layer
Soils <-
local({
    A <- readWKT("MULTIPOLYGON(((3 .5,7 1,7 2,3 1.5,3 0.5), (3 1.5,7 2,7 3,3 2.5,3 1.5)))")
    AA <- flattenSpatialPolygons(A)
    SpatialPolygonsDataFrame(AA,
           data.frame(soilType = paste0("Soil_", LETTERS[seq_along(AA)]),
                      row.names = getSpPPolygonsIDSlots(AA)))
})

## Example Parcels layer
Parcels <-
local({
    B <- readWKT("MULTIPOLYGON(((0 0,2 0,2 3,0 3,0 0),(2 0,4 0,4 3,2 3,2 0)),((4 0,6 0,6 3,4 3,4 0)))")
    BB <- flattenSpatialPolygons(B)
    SpatialPolygonsDataFrame(BB,
           data.frame(soilType = paste0("Parcel_", seq_along(BB)),
                      row.names = getSpPPolygonsIDSlots(BB)))
})
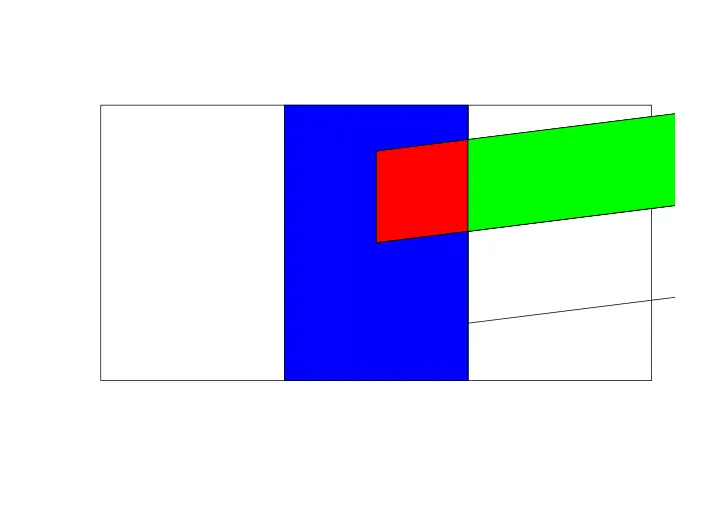
%over%还是overlay?请参考 gis.SE 和 @Spacedman 的备忘单:http://www.maths.lancs.ac.uk/~rowlings/Teaching/UseR2012/cheatsheet.html - Ari B. Friedmanover()不是我想要的。就像我说的,我需要一个返回单个多边形的函数,而不仅仅是它们是否重叠的指示器。(此外,即使我可以构造原子多边形,over等也没有帮助,因为它们将共享边界的多边形计算为彼此“覆盖”。rgeos::gRelate()在这方面更好。) - Josh O'BriengIntersection和gSymdifference的组合是我得到的最接近的结果,但它没有获取原子多边形(即底部图中不包含任何线条的10个多边形)。这似乎是一个非常基本的GIS操作,我将很高兴向展示如何在R中完成它(或通过调用其他易于链接的GIS)的人提供赏金... - Josh O'Brien