在Python中使用sklearn线性回归得到置信区间

15

我想获得一次线性回归结果的置信区间。我正在使用波士顿房价数据集。

我找到了这个问题:如何在python中计算线性回归模型斜率的99%置信区间?,但是这并不能完全回答我的问题。

这是我的代码:

import numpy as np
import matplotlib.pyplot as plt
from math import pi

import pandas as pd
import seaborn as sns
from sklearn.datasets import load_boston
from sklearn.model_selection import train_test_split
from sklearn.linear_model import LinearRegression
from sklearn.metrics import mean_squared_error, r2_score

# import the data
boston_dataset = load_boston()

boston = pd.DataFrame(boston_dataset.data, columns=boston_dataset.feature_names)
boston['MEDV'] = boston_dataset.target

X = pd.DataFrame(np.c_[boston['LSTAT'], boston['RM']], columns=['LSTAT', 'RM'])
Y = boston['MEDV']

# splits the training and test data set in 80% : 20%
# assign random_state to any value.This ensures consistency.
X_train, X_test, Y_train, Y_test = train_test_split(X, Y, test_size=0.2, random_state=5)

lin_model = LinearRegression()
lin_model.fit(X_train, Y_train)

# model evaluation for training set

y_train_predict = lin_model.predict(X_train)
rmse = (np.sqrt(mean_squared_error(Y_train, y_train_predict)))
r2 = r2_score(Y_train, y_train_predict)

# model evaluation for testing set

y_test_predict = lin_model.predict(X_test)
# root mean square error of the model
rmse = (np.sqrt(mean_squared_error(Y_test, y_test_predict)))

# r-squared score of the model
r2 = r2_score(Y_test, y_test_predict)

plt.scatter(Y_test, y_test_predict)
plt.show()

我该如何从这个数据中获取95%或99%的置信区间?是否有内置函数或代码可以使用?
2个回答

9
如果您想计算回归参数的置信区间,一种方法是使用scikit-learn和numpy方法的LinearRegression结果手动计算它。
下面的代码计算95%置信区间(alpha=0.05)。alpha=0.01将计算99%置信区间等。
import numpy as np
import pandas as pd
from scipy import stats
from sklearn.linear_model import LinearRegression

alpha = 0.05 # for 95% confidence interval; use 0.01 for 99%-CI.

# fit a sklearn LinearRegression model
lin_model = LinearRegression().fit(X_train, Y_train)

# the coefficients of the regression model
coefs = np.r_[[lin_model.intercept_], lin_model.coef_]
# build an auxiliary dataframe with the constant term in it
X_aux = X_train.copy()
X_aux.insert(0, 'const', 1)
# degrees of freedom
dof = -np.diff(X_aux.shape)[0]
# Student's t-distribution table lookup
t_val = stats.t.isf(alpha/2, dof)
# MSE of the residuals
mse = np.sum((Y_train - lin_model.predict(X_train)) ** 2) / dof
# inverse of the variance of the parameters
var_params = np.diag(np.linalg.inv(X_aux.T.dot(X_aux)))
# distance between lower and upper bound of CI
gap = t_val * np.sqrt(mse * var_params)

conf_int = pd.DataFrame({'lower': coefs - gap, 'upper': coefs + gap}, index=X_aux.columns)

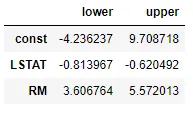
使用波士顿房价数据集,上述代码生成以下数据框:

res


如果这些手动编码太多,您总可以求助于statsmodels并使用其conf_int方法:

import statsmodels.api as sm
alpha = 0.05 # 95% confidence interval
lr = sm.OLS(Y_train, sm.add_constant(X_train)).fit()
conf_interval = lr.conf_int(alpha)

由于它使用相同的公式,因此它产生与上面相同的输出。


方便的包装函数:

import numpy as np
import pandas as pd
from scipy import stats
from sklearn.linear_model import LinearRegression


def get_conf_int(alpha, lr, X=X_train, y=Y_train):
    
    """
    Returns (1-alpha) 2-sided confidence intervals
    for sklearn.LinearRegression coefficients
    as a pandas DataFrame
    """
    
    coefs = np.r_[[lr.intercept_], lr.coef_]
    X_aux = X.copy()
    X_aux.insert(0, 'const', 1)
    dof = -np.diff(X_aux.shape)[0]
    mse = np.sum((y - lr.predict(X)) ** 2) / dof
    var_params = np.diag(np.linalg.inv(X_aux.T.dot(X_aux)))
    t_val = stats.t.isf(alpha/2, dof)
    gap = t_val * np.sqrt(mse * var_params)

    return pd.DataFrame({
        'lower': coefs - gap, 'upper': coefs + gap
    }, index=X_aux.columns)


# for 95% confidence interval; use 0.01 for 99%-CI.
alpha = 0.05
# fit a sklearn LinearRegression model
lin_model = LinearRegression().fit(X_train, Y_train)

get_conf_int(alpha, lin_model, X_train, Y_train)

统计参考


如果我们想使用自助法或交叉验证来计算置信区间,会怎样呢? - undefined
1
@skan 我猜一种方法是计算每个训练集的置信区间(CI)。然而,我不知道这个统计量的相关性如何,因为置信区间是推断性的,而交叉验证是关于改进预测的,这两个问题的目标不一定重叠。 - undefined

0

我不确定是否有任何内置函数可以实现这个目的,但我的做法是创建一个循环n次,并比较所有模型的准确性,保存具有最高准确性的模型并使用pickle在以后重复使用。

以下是代码:

for _ in range(30):
x_train, x_test, y_train, y_test = sklearn.model_selection.train_test_split(X, y, test_size=0.1)

linear = linear_model.LinearRegression()

linear.fit(x_train, y_train)
acc = linear.score(x_test, y_test)
print("Accuracy: " + str(acc))

if acc > best:
    best = acc
    with open("confidence_interval.pickle", "wb") as f:
    pickle.dump(linear, f)
    print("The best Accuracy: ", best)

你可以随时更改给定的变量,因为我知道你提供的变量与我的变量差异很大。如果你想预测类别可能性,可以使用predict_proba。请参考此链接了解predictpredict_proba之间的区别https://www.kaggle.com/questions-and-answers/82657


网页内容由stack overflow 提供, 点击上面的
可以查看英文原文,
原文链接