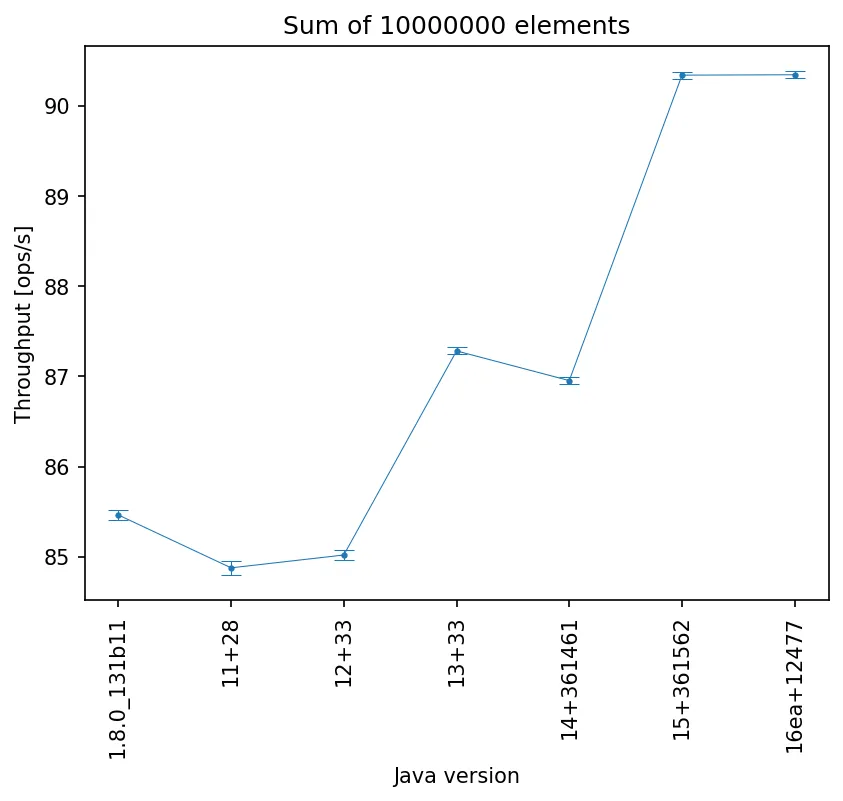
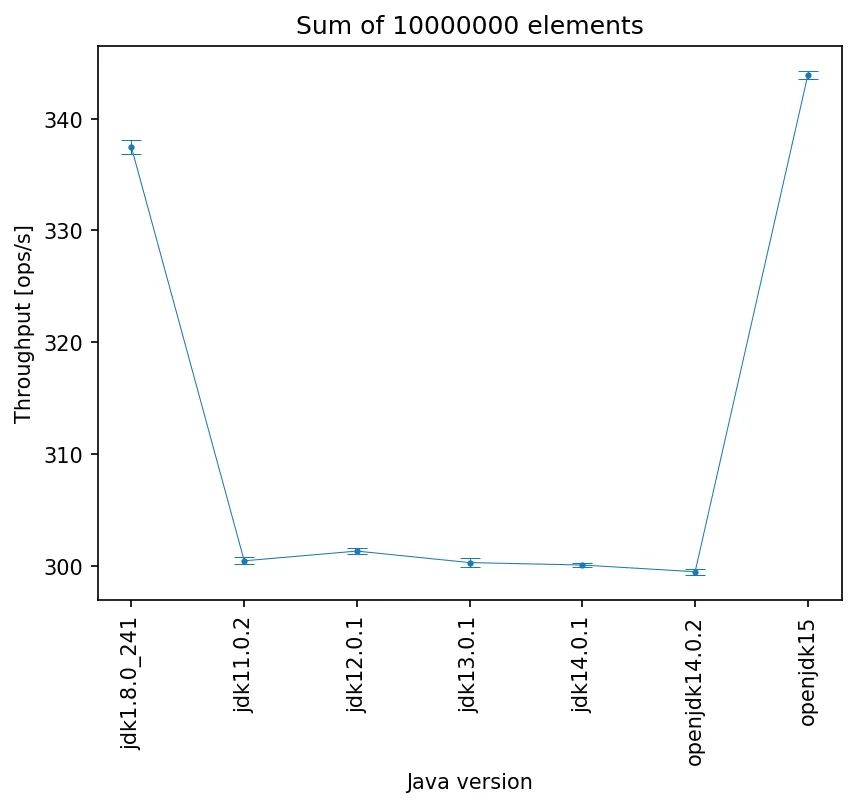
使用for循环将数组中的所有元素相加的性能(吞吐量)在新版JVM上比Java 1.8.0 JDK中的JVM慢。我进行了JHM基准测试(下面是图表)。在每次测试之前,使用提供的javac.exe编译源代码,并使用所选JDK提供的java.exe运行。测试在Windows 10上执行,并由powershell脚本启动,没有其他jvms在后台运行。计算机配备32GB RAM,因此不使用HDD上的虚拟内存。
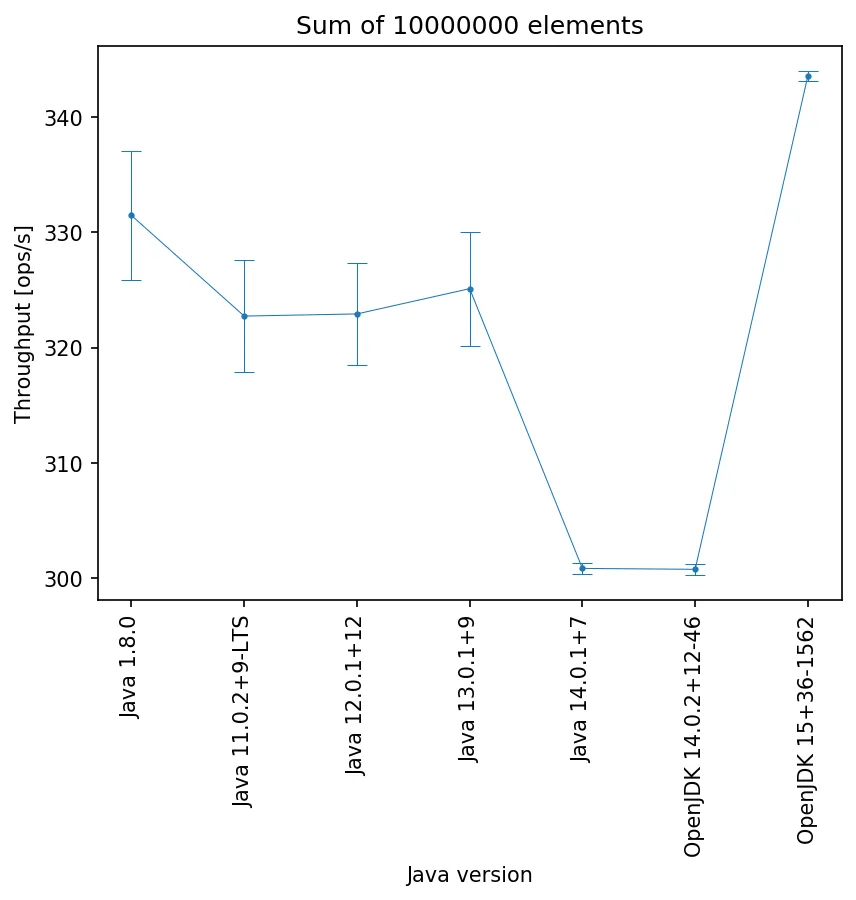
数组中有10M个元素:
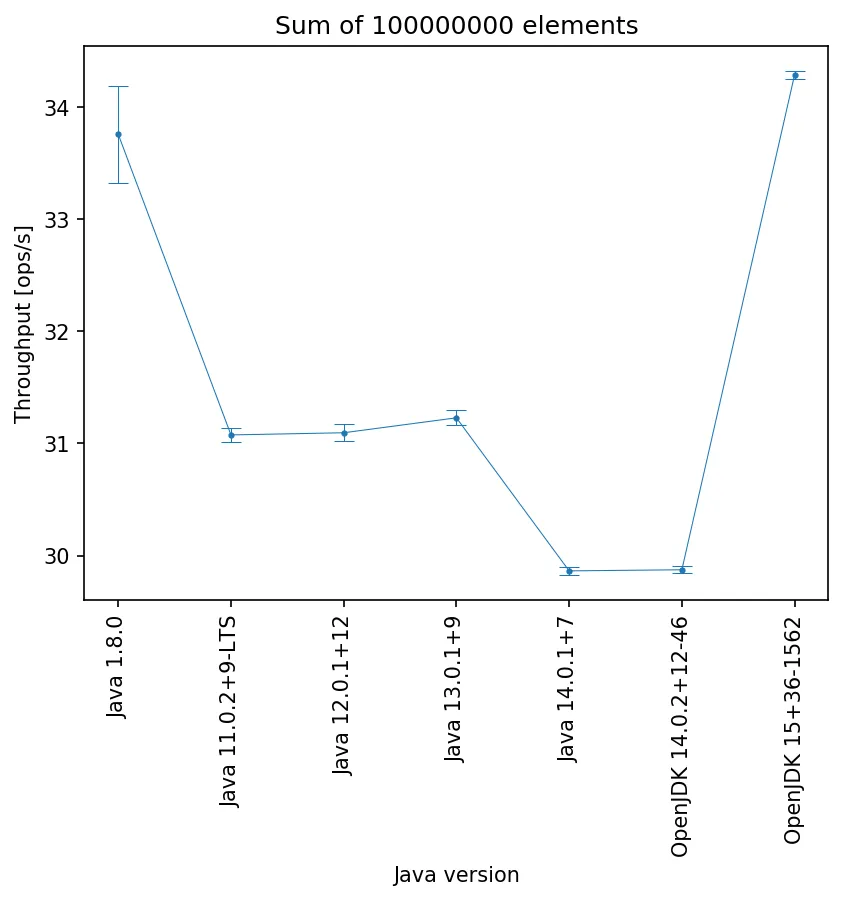
数组中有100M个元素:
我的测试源代码:
@Param({"10000000", "100000000"})
public static int ELEMENTS;

public static void main(String[] args) throws RunnerException, IOException {
    File outputFile = new File(args[0]);

    int javaMajorVersion = Integer.parseInt(System.getProperty("java.version").split("\\.")[0]);

    ChainedOptionsBuilder builder = new OptionsBuilder()
            .include(IteratingBenchmark.class.getSimpleName())
            .mode(Mode.Throughput)
            .forks(2)
            .measurementTime(TimeValue.seconds(10))
            .measurementIterations(50)
            .warmupTime(TimeValue.seconds(2))
            .warmupIterations(10)
            .resultFormat(ResultFormatType.SCSV)
            .result(outputFile.getAbsolutePath());

    if (javaMajorVersion > 8) {
        builder = builder.jvmArgs("-Xms20g", "-Xmx20g", "--enable-preview");
    } else {
        builder = builder.jvmArgs("-Xms20g", "-Xmx20g");
    }

    new Runner(builder.build()).run();
}

@Benchmark
public static void cStyleForLoop(Blackhole bh, MockData data) {
    long sum = 0;
    for (int i = 0; i < data.randomInts.length; i++) {
        sum += data.randomInts[i];
    }

    bh.consume(sum);
}

@State(Scope.Thread)
public static class MockData {
    private int[] randomInts = new int[ELEMENTS];

    @Setup(Level.Iteration)
    public void setup() {
        Random r = new Random();
        this.randomInts = Stream.iterate(r.nextInt(), i -> i + r.nextInt(1022) + 1).mapToInt(Integer::intValue).limit(ELEMENTS).toArray();
    }
}
原始数据:
JDK 1.8.0_241:
"Benchmark";"Mode";"Threads";"Samples";"Score";"Score Error (99,9%)";"Unit";"Param: ELEMENTS"
"benchmark.IteratingBenchmark.cStyleForLoop";"thrpt";1;100;331,446104;5,563589;"ops/s";10000000
"benchmark.IteratingBenchmark.cStyleForLoop";"thrpt";1;100;33,757268;0,431403;"ops/s";100000000

JDK 11.0.2:
"Benchmark";"Mode";"Threads";"Samples";"Score";"Score Error (99,9%)";"Unit";"Param: ELEMENTS"
"benchmark.IteratingBenchmark.cStyleForLoop";"thrpt";1;100;322,728461;4,823611;"ops/s";10000000
"benchmark.IteratingBenchmark.cStyleForLoop";"thrpt";1;100;31,075948;0,062830;"ops/s";100000000

JDK 12.0.1:
"Benchmark";"Mode";"Threads";"Samples";"Score";"Score Error (99,9%)";"Unit";"Param: ELEMENTS"
"benchmark.IteratingBenchmark.cStyleForLoop";"thrpt";1;100;322,914782;4,450969;"ops/s";10000000
"benchmark.IteratingBenchmark.cStyleForLoop";"thrpt";1;100;31,095232;0,075051;"ops/s";100000000

JDK 13.0.1:
"Benchmark";"Mode";"Threads";"Samples";"Score";"Score Error (99,9%)";"Unit";"Param: ELEMENTS"
"benchmark.IteratingBenchmark.cStyleForLoop";"thrpt";1;100;325,103055;4,933257;"ops/s";10000000
"benchmark.IteratingBenchmark.cStyleForLoop";"thrpt";1;100;31,228403;0,067954;"ops/s";100000000

JDK 14.0.1:
"Benchmark";"Mode";"Threads";"Samples";"Score";"Score Error (99,9%)";"Unit";"Param: ELEMENTS"
"benchmark.IteratingBenchmark.cStyleForLoop";"thrpt";1;100;300,861148;0,443404;"ops/s";10000000
"benchmark.IteratingBenchmark.cStyleForLoop";"thrpt";1;100;29,863602;0,035781;"ops/s";100000000

OpenJDK 14.0.2:
"Benchmark";"Mode";"Threads";"Samples";"Score";"Score Error (99,9%)";"Unit";"Param: ELEMENTS"
"benchmark.IteratingBenchmark.cStyleForLoop";"thrpt";1;100;300,781930;0,481579;"ops/s";10000000
"benchmark.IteratingBenchmark.cStyleForLoop";"thrpt";1;100;29,873509;0,033055;"ops/s";100000000

OpenJDK 15:
"Benchmark";"Mode";"Threads";"Samples";"Score";"Score Error (99,9%)";"Unit";"Param: ELEMENTS"
"benchmark.IteratingBenchmark.cStyleForLoop";"thrpt";1;100;343,530895;0,445551;"ops/s";10000000
"benchmark.IteratingBenchmark.cStyleForLoop";"thrpt";1;100;34,287083;0,035028;"ops/s";100000000
是否有任何有效的解释,为什么比Java 1.8更新版本慢(除了OpenJDK 15)?
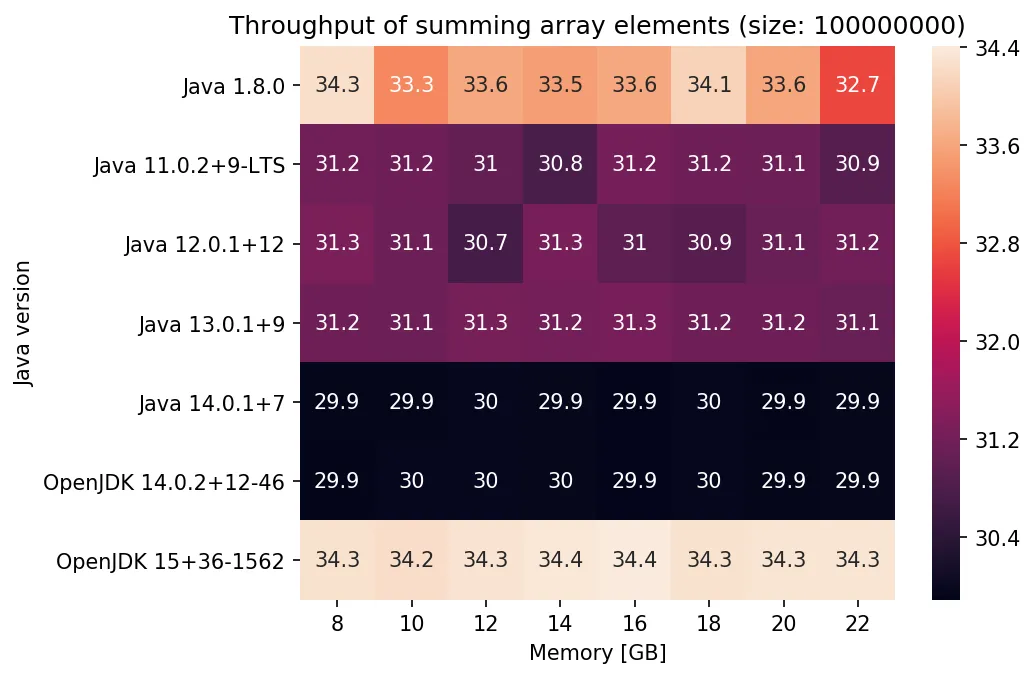
更新1:
我对不同Xmx / Xms值运行相同的测试(对于每个测试Xmx == Xms),结果如下:
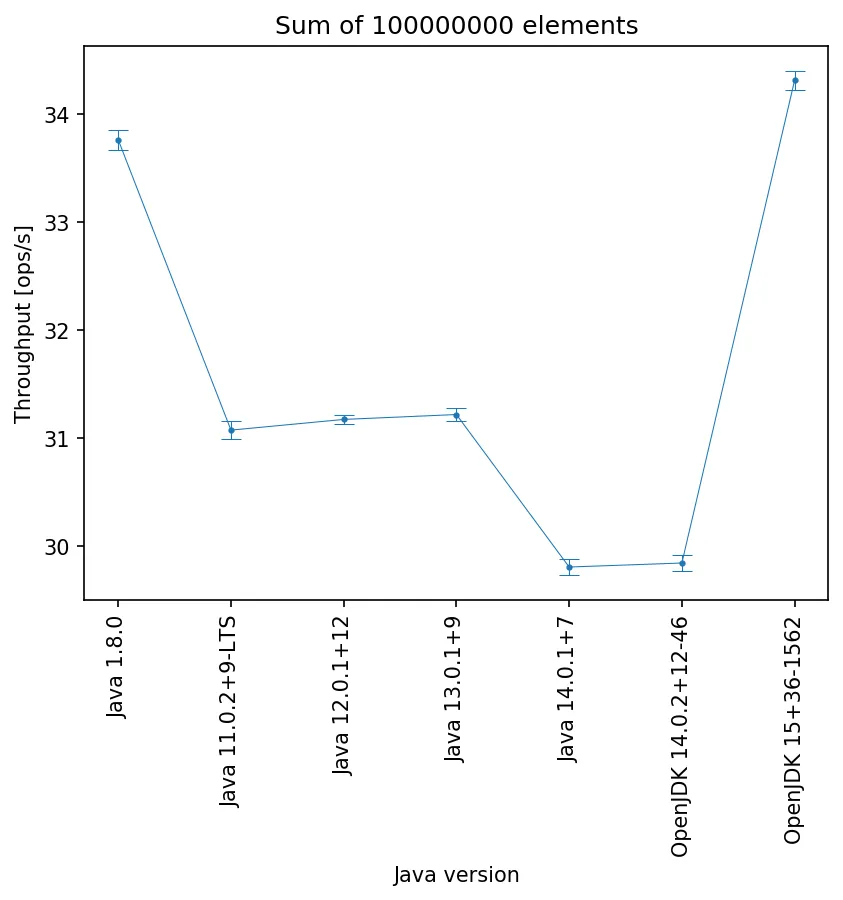
更新2:
- 首先,我将
Level.Iteration更改为Level.Trial。 - 其次,我强制使用G1垃圾回收器。
- 第三,Xmx/Xms设置为8GB。
结果:
原始数据:
JDK 1.8.0_241:
"Benchmark";"Mode";"Threads";"Samples";"Score";"Score Error (99,9%)";"Unit";"Param: ELEMENTS"
"benchmark.IteratingBenchmark.cStyleForLoop";"thrpt";1;15;33,760346;0,089646;"ops/s";100000000

JDK 11.0.2:
"Benchmark";"Mode";"Threads";"Samples";"Score";"Score Error (99,9%)";"Unit";"Param: ELEMENTS"
"benchmark.IteratingBenchmark.cStyleForLoop";"thrpt";1;15;31,075120;0,086171;"ops/s";100000000

JDK 12.0.1:
"Benchmark";"Mode";"Threads";"Samples";"Score";"Score Error (99,9%)";"Unit";"Param: ELEMENTS"
"benchmark.IteratingBenchmark.cStyleForLoop";"thrpt";1;15;31,173939;0,044176;"ops/s";100000000

JDK 13.0.1:
"Benchmark";"Mode";"Threads";"Samples";"Score";"Score Error (99,9%)";"Unit";"Param: ELEMENTS"
"benchmark.IteratingBenchmark.cStyleForLoop";"thrpt";1;15;31,219283;0,062329;"ops/s";100000000

JDK 14.0.1:
"Benchmark";"Mode";"Threads";"Samples";"Score";"Score Error (99,9%)";"Unit";"Param: ELEMENTS"
"benchmark.IteratingBenchmark.cStyleForLoop";"thrpt";1;15;29,808609;0,072664;"ops/s";100000000

OpenJDK 14.0.2:
"Benchmark";"Mode";"Threads";"Samples";"Score";"Score Error (99,9%)";"Unit";"Param: ELEMENTS"
"benchmark.IteratingBenchmark.cStyleForLoop";"thrpt";1;15;29,845817;0,074315;"ops/s";100000000

OpenJDK 15:
"Benchmark";"Mode";"Threads";"Samples";"Score";"Score Error (99,9%)";"Unit";"Param: ELEMENTS"
"benchmark.IteratingBenchmark.cStyleForLoop";"thrpt";1;15;34,310620;0,087412;"ops/s";100000000
更新3:
我制作了一个GitHub代码库,其中包含基准源代码和用于执行JMH参数的脚本,该脚本会自动生成png格式的图形。
此外,我还在其他机器(Linux)上进行了基准测试。
来自Linux机器的结果似乎更加乐观:
不幸的是,在我的Windows机器上,结果仍然显示性能下降(不包括JDK 15)。
更新4:
使用-XX:-UseCountedLoopSafepoints的结果:
this.randomInts = r.ints(ELEMENTS).toArray();即可。有趣的是,给它们全部相同的种子是否会产生影响。我不期望实际整数值对性能产生任何影响。 - HolgerLevel.Trial而不是Level.Iteration。2)在所有JDK版本上设置相同的GC(JDK 8与9+中的默认GC不同)。 - apangin