在Matplotlib中,我如何设置上标的字体大小(除了控制基础字体大小之外)?例如,在Matplotlib中创建带有科学记数法的轴:可以轻松设置刻度标签的字体大小,但是如何指定其指数的字体大小?我想在基础和指数上分别进行控制(即通过调整刻度标签的字体大小来获得所需大小的指数不是一个好的选择-我们能否修改基础和指数字体大小的比例?)。谢谢。
1个回答
9
如果您有指数,那么您获得文本的可能性基本上有两种:
1.使用外部TeX安装(在这种情况下,您具有
2.通过使用内置于
如果您使用外部TeX安装,则由TeX决定(我猜测类似于
如果您使用“标准”方法,则字体大小比例硬编码到
在说了“没有办法”之后,我将展示一种方法。但这不是一条美丽的道路......
由于
在该文件中,应该有大约1200行左右的内容:
您可以更改这些内容以使文本间距不同。例如,让我们制作一个简单的测试图表:
这将产生以下结果:
1.使用外部TeX安装(在这种情况下,您具有
rcParams ['text.usetex'] == True)。2.通过使用内置于
matplotlib的mathtext Tex克隆。如果您使用外部TeX安装,则由TeX决定(我猜测类似于
\DeclareMathSizes {10} {18} {12} {8},但我没有尝试过)。如果您使用“标准”方法,则字体大小比例硬编码到
matplotlib中。因此,没有办法改变它们;根据Donald Knuth的原始TeX规范,上标是基础字体的70%。在说了“没有办法”之后,我将展示一种方法。但这不是一条美丽的道路......
由于
matplotlib大多数是用Python编写的,您可以更改很多内容。您想要的参数位于文件.../matplotlib/mathtext.py中。该...取决于您的Python发行版和操作系统。(例如,我的是/opt/local/Library/Frameworks/Python.framework/Versions/2.7/lib/python2.7/site-packages/matplotlib/mathtext.py)在该文件中,应该有大约1200行左右的内容:
# How much text shrinks when going to the next-smallest level.  GROW_FACTOR
# must be the inverse of SHRINK_FACTOR.
SHRINK_FACTOR   = 0.7
GROW_FACTOR     = 1.0 / SHRINK_FACTOR
# The number of different sizes of chars to use, beyond which they will not
# get any smaller
NUM_SIZE_LEVELS = 6
# Percentage of x-height of additional horiz. space after sub/superscripts
SCRIPT_SPACE    = 0.2
# Percentage of x-height that sub/superscripts drop below the baseline
SUBDROP         = 0.3
# Percentage of x-height that superscripts drop below the baseline
SUP1            = 0.5
# Percentage of x-height that subscripts drop below the baseline
SUB1            = 0.0
# Percentage of x-height that superscripts are offset relative to the subscript
DELTA           = 0.18
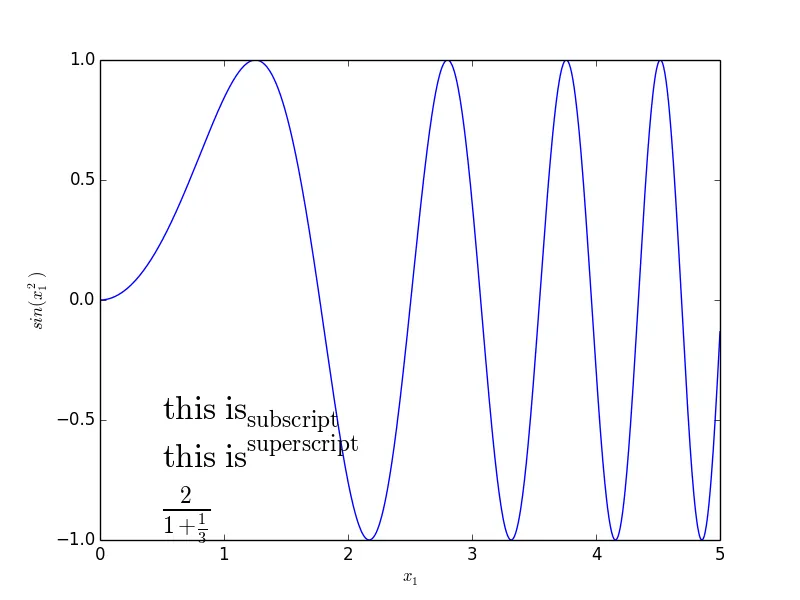
您可以更改这些内容以使文本间距不同。例如,让我们制作一个简单的测试图表:
import matplotlib.pyplot as plt
import numpy as np

x = np.linspace(0,5, 1000)
y = np.sin(x**2)
fig = plt.figure()
ax = fig.add_subplot(111)
ax.plot(x, y)
ax.set_xlabel(r'$x_1$')
ax.set_ylabel(r'$sin(x_1^2)$')
ax.text(.5, -.5, r'$\rm{this\ is}_\mathrm{subscript}$', fontsize=24)
ax.text(.5, -.7, r'$\rm{this\ is}^\mathrm{superscript}$', fontsize=24)
ax.text(.5, -.9, r'$\frac{2}{1+\frac{1}{3}}$', fontsize=24)
这将产生以下结果:
import matplotlib

matplotlib.mathtext.SHRINK_FACTOR = 0.5
matplotlib.mathtext.GROW_FACTOR = 1 / 0.5
然后再次运行相同的绘图代码:
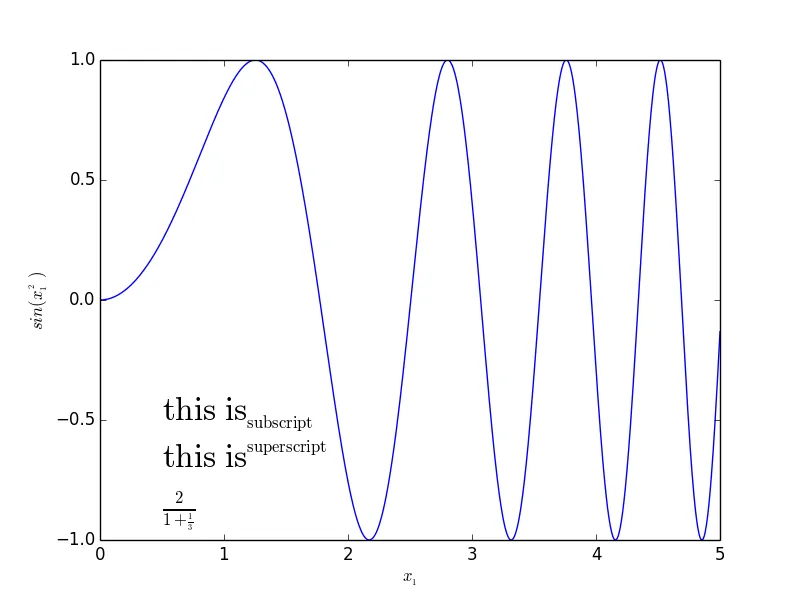
您可以看到,上标/下标的大小发生了变化。但不幸的是,这会对分数产生副作用。
- DrV
3
网页内容由stack overflow 提供, 点击上面的可以查看英文原文,
原文链接
原文链接
mpl.mathtext.FontConstantsBase.sup1 = 0.9才能产生效果。仅更改 mpl.mathtext.sup1 不起作用。参见:https://stackoverflow.com/questions/41837171/matplotlib-2-0-subscript-outside-of-baseline-when-super-and-subscript-are-both-u - heisenBug