有没有办法告诉Dot使用集群但不显示子图节点周围的矩形?
5个回答
24
您可以使用style来实现这一点。
以下是使用style=invis的示例:
digraph g{
 subgraph cluster0 {
  style=invis;
  1 -> 2;
 }
}
如果您想将此作为所有子图的默认设置,请使用 subgraph[style=invis]:
digraph g{
 subgraph[style=invis];

 subgraph cluster0 {
  1 -> 2;
 }
}
编辑: 九年后...
最佳解决方案是使用
peripheries=0
这实际上会防止在svg输出中生成矩形,而penwidth=0仍然包括一个多边形(带有stroke-width="0",但它仍然存在)。
我已经添加了这个答案,因为它是最受欢迎的答案。
- marapet
7
8
您可以使用
作为上述style=invis方法的替代方案,您也可以设置pencolor=transparent(本地或全局均可)。
style=invis:subgraph cluster1 {
style=invis
...
}
作为上述style=invis方法的替代方案,您也可以设置pencolor=transparent(本地或全局均可)。
- ivanm
2
style=invis 方法不再适用,我将编辑答案。 - mirelon3非常感谢!与“style=invis”不同,“pencolor=transparent”实际上保留了子图的标签。 - MisterMiyagi
4
这可以通过使用
尽管
正如@marapet所指出的,
penwidth = 0属性来实现。这既不影响标签文本,也不改变群集的边界框。根据图形驱动程序的不同,这可能会输出零宽度边界。使用建议的peripheries = 0属性会强制默认的矩形环绕被移除作为副作用。尽管
style = invis和pencolor = transparent属性在大多数情况下都有效,但有时需要避免压缩群集标签并在群集周围留下透明线条。正如@marapet所指出的,
peripheries = 0将从像SVG这样的矢量输出格式中移除发丝线,这些格式可以进一步处理。- Pekka
1
您也可以使用 peripheries=0。
- sroush
0
在不需要边框的子图中使用penwidth = 0。
这是我如何使用它。它只会移除群集边框,不会像style = invis那样产生任何副作用,后者也倾向于移除图标签(在我的情况下不需要)。
digraph {
    subgraph cluster2 {
        label="set"

        subgraph cluster0 {
            penwidth = 0
            label="hello"
            1 -> 2;
        }

        subgraph cluster1 {
            //penwidth = 0
            label="world"
            3 -> 2;
        }
    }
}
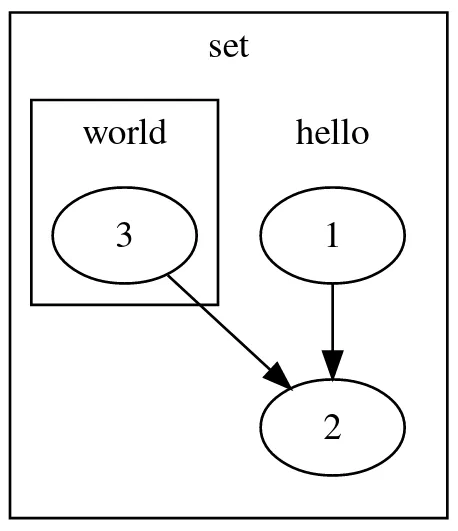
请查看此处的实时预览
<?xml version="1.0" encoding="UTF-8" standalone="no"?>
<!DOCTYPE svg PUBLIC "-//W3C//DTD SVG 1.1//EN"
"http://www.w3.org/Graphics/SVG/1.1/DTD/svg11.dtd">
<!-- Generated by graphviz version 2.40.1 (20161225.0304)
-->
<!-- Title: %0 Pages: 1 -->
<svg width="188pt" height="214pt" viewBox="0.00 0.00 188.00 213.60" xmlns="http://www.w3.org/2000/svg" xmlns:xlink="http://www.w3.org/1999/xlink">
<g id="graph0" class="graph" transform="scale(1 1) rotate(0) translate(4 209.6)">
<title>%0</title>
<polygon fill="#ffffff" stroke="transparent" points="-4,4 -4,-209.6 184,-209.6 184,4 -4,4"/>
<g id="clust1" class="cluster">
<title>cluster2</title>
<polygon fill="none" stroke="#000000" points="8,-8 8,-197.6 172,-197.6 172,-8 8,-8"/>
<text text-anchor="middle" x="90" y="-181" font-family="Times,serif" font-size="14.00" fill="#000000">set</text>
</g>
<g id="clust2" class="cluster">
<title>cluster0</title>
<polygon fill="none" stroke="#000000" stroke-width="0" points="94,-16 94,-164.8 164,-164.8 164,-16 94,-16"/>
<text text-anchor="middle" x="129" y="-148.2" font-family="Times,serif" font-size="14.00" fill="#000000">hello</text>
</g>
<g id="clust3" class="cluster">
<title>cluster1</title>
<polygon fill="none" stroke="#000000" points="16,-88 16,-164.8 86,-164.8 86,-88 16,-88"/>
<text text-anchor="middle" x="51" y="-148.2" font-family="Times,serif" font-size="14.00" fill="#000000">world</text>
</g>
<!-- 1 -->
<g id="node1" class="node">
<title>1</title>
<ellipse fill="none" stroke="#000000" cx="129" cy="-114" rx="27" ry="18"/>
<text text-anchor="middle" x="129" y="-109.8" font-family="Times,serif" font-size="14.00" fill="#000000">1</text>
</g>
<!-- 2 -->
<g id="node2" class="node">
<title>2</title>
<ellipse fill="none" stroke="#000000" cx="129" cy="-42" rx="27" ry="18"/>
<text text-anchor="middle" x="129" y="-37.8" font-family="Times,serif" font-size="14.00" fill="#000000">2</text>
</g>
<!-- 1->2 -->
<g id="edge1" class="edge">
<title>1->2</title>
<path fill="none" stroke="#000000" d="M129,-95.8314C129,-88.131 129,-78.9743 129,-70.4166"/>
<polygon fill="#000000" stroke="#000000" points="132.5001,-70.4132 129,-60.4133 125.5001,-70.4133 132.5001,-70.4132"/>
</g>
<!-- 3 -->
<g id="node3" class="node">
<title>3</title>
<ellipse fill="none" stroke="#000000" cx="51" cy="-114" rx="27" ry="18"/>
<text text-anchor="middle" x="51" y="-109.8" font-family="Times,serif" font-size="14.00" fill="#000000">3</text>
</g>
<!-- 3->2 -->
<g id="edge2" class="edge">
<title>3->2</title>
<path fill="none" stroke="#000000" d="M67.1617,-99.0816C78.3214,-88.7802 93.3334,-74.923 105.7715,-63.4417"/>
<polygon fill="#000000" stroke="#000000" points="108.1519,-66.0076 113.1259,-56.653 103.4039,-60.864 108.1519,-66.0076"/>
</g>
</g>
</svg>- avimehenwal
网页内容由stack overflow 提供, 点击上面的可以查看英文原文,
原文链接
原文链接
peripheries=0比penwidth=0更好。 - marapet