在MATLAB中的自组织映射(SOM)问题

3

我有一个包含数据的文本文件。 我的文本文件:

young, myopic, no, reduced, no
young, myopic, no, normal, soft
young, myopic, yes, reduced, no
young, myopic, yes, normal, hard
young, hyperopia, no, reduced, no
young, hyperopia, no, normal, soft
young, hyperopia, yes, reduced, no
young, hyperopia, yes, normal, hard

我阅读了文本文件的加载方法。
%young=1
%myopic=2
%no=3 etc.

load iris.txt
net = newsom(1,[1 5]);
[net,tr] = train(net,1);
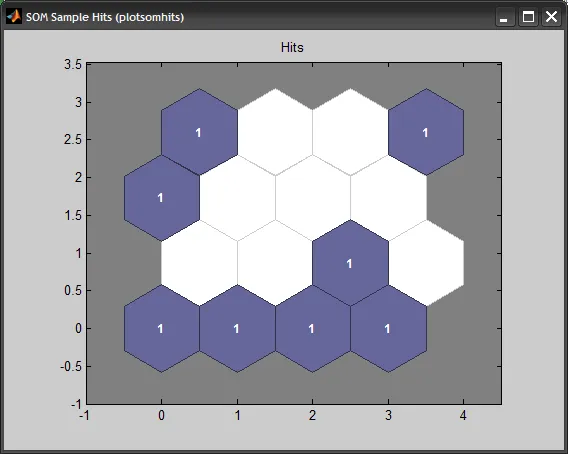
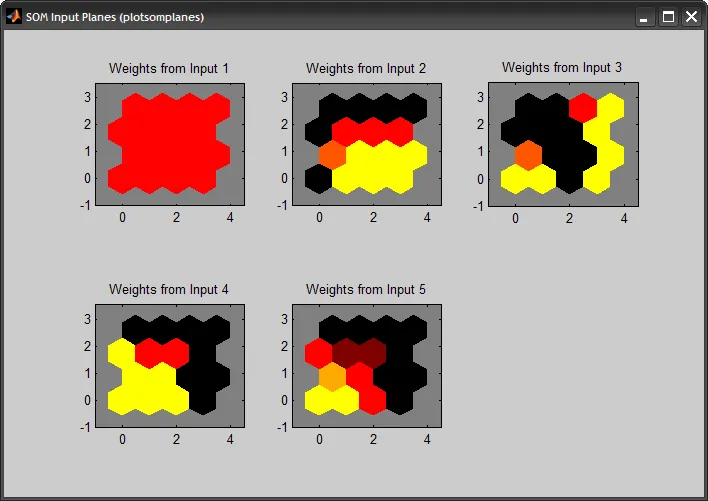
plotsomplanes(net);

错误代码:

??? 未定义的函数或方法 'trainingplot',输入参数类型为 'network'。

该错误提示意味着您正在尝试使用一个在当前环境中未定义的函数或方法。请确保该函数或方法已正确安装并在当前环境中可用。
1个回答

8

鉴于您展示的文本文件,LOAD函数将无法工作。您应该使用TEXTSCAN来解析文本文件。然后我使用GRP2IDX将名义数据转换为数字属性(它将为每个属性值分配1,2,3等)。在这种情况下,数据变为:

>> data =
     1     1     1     1     1
     1     1     1     2     2
     1     1     2     1     1
     1     1     2     2     3
     1     2     1     1     1
     1     2     1     2     2
     1     2     2     1     1
     1     2     2     2     3

>> labels{:}
ans = 
    'young'
ans = 
    'myopic'
    'hyperopia'
ans = 
    'no'
    'yes'
ans = 
    'reduced'
    'normal'
ans = 
    'no'
    'soft'
    'hard'

我应该提到,您可能需要更大的数据集(更多实例)才能获得任何有意义的结果...

%# read text file
fid = fopen('iris.txt');
D = textscan(fid, '%s %s %s %s %s', 'Delimiter',',');
fclose(fid);

%# convert nominal to numeric
%#data = cell2mat( cellfun(@grp2idx, D, 'UniformOutput',false) );
data = zeros(numel(D{1}),numel(D));
labels = cell(size(D));
for i=1:numel(D)
    [data(:,i) labels{i}] = grp2idx(D{i});
end

%# build SOM
net = newsom(data', [4 4]);
[net,tr] = train(net, data');
figure, plotsomhits(net, data')
figure, plotsomplanes(net)

alt text alt text


网页内容由stack overflow 提供, 点击上面的
可以查看英文原文,
原文链接