我正在使用matplotlib绘制条形图,但是当我尝试访问标签(无论是X轴还是Y轴)以更改它们时,遇到了问题。特别是这段代码:
fig = plot.figure(figsize=(16,12), dpi=(300))
ax1 = fig.add_subplot(111)
ax1.set_ylabel("simulated quantity")
ax1.set_xlabel("simulated peptides - from most to least abundant")

# create the bars, and set a different color for the bars referring to experimental peptides
barlist = ax1.bar( numpy.arange(len(quantities)), [numpy.log10(x) for x in quantities] )
for index, peptide in enumerate(peptides) :
        if peptide in experimentalPeptidesP or peptide in experimentalPeptidesUP :
                barlist[index].set_color('b')

labelsY = ax1.get_yticklabels(which='both')
print "These are the label objects on the Y axis:", labelsY
print "These are the labels on the Y axis:", [item.get_text() for item in ax1.get_xticklabels(    which='both')]
for label in labelsY : label.set_text("AAAAA")
ax1.set_yticklabels(labelsY)
给出以下输出:
These are the label objects on the Y axis: <a list of 8 Text yticklabel objects>
These are the labels on the Y axis: [u'', u'', u'', u'', u'', u'']
结果图上每个Y轴标签的文本都是“AAAAA”,就像要求的一样。我的问题是,虽然我能够正确地设置标签,但显然我无法获取它们的文本……而文本应该存在,因为如果我不用“AAAAA”替换标签,我会得到以下图形:
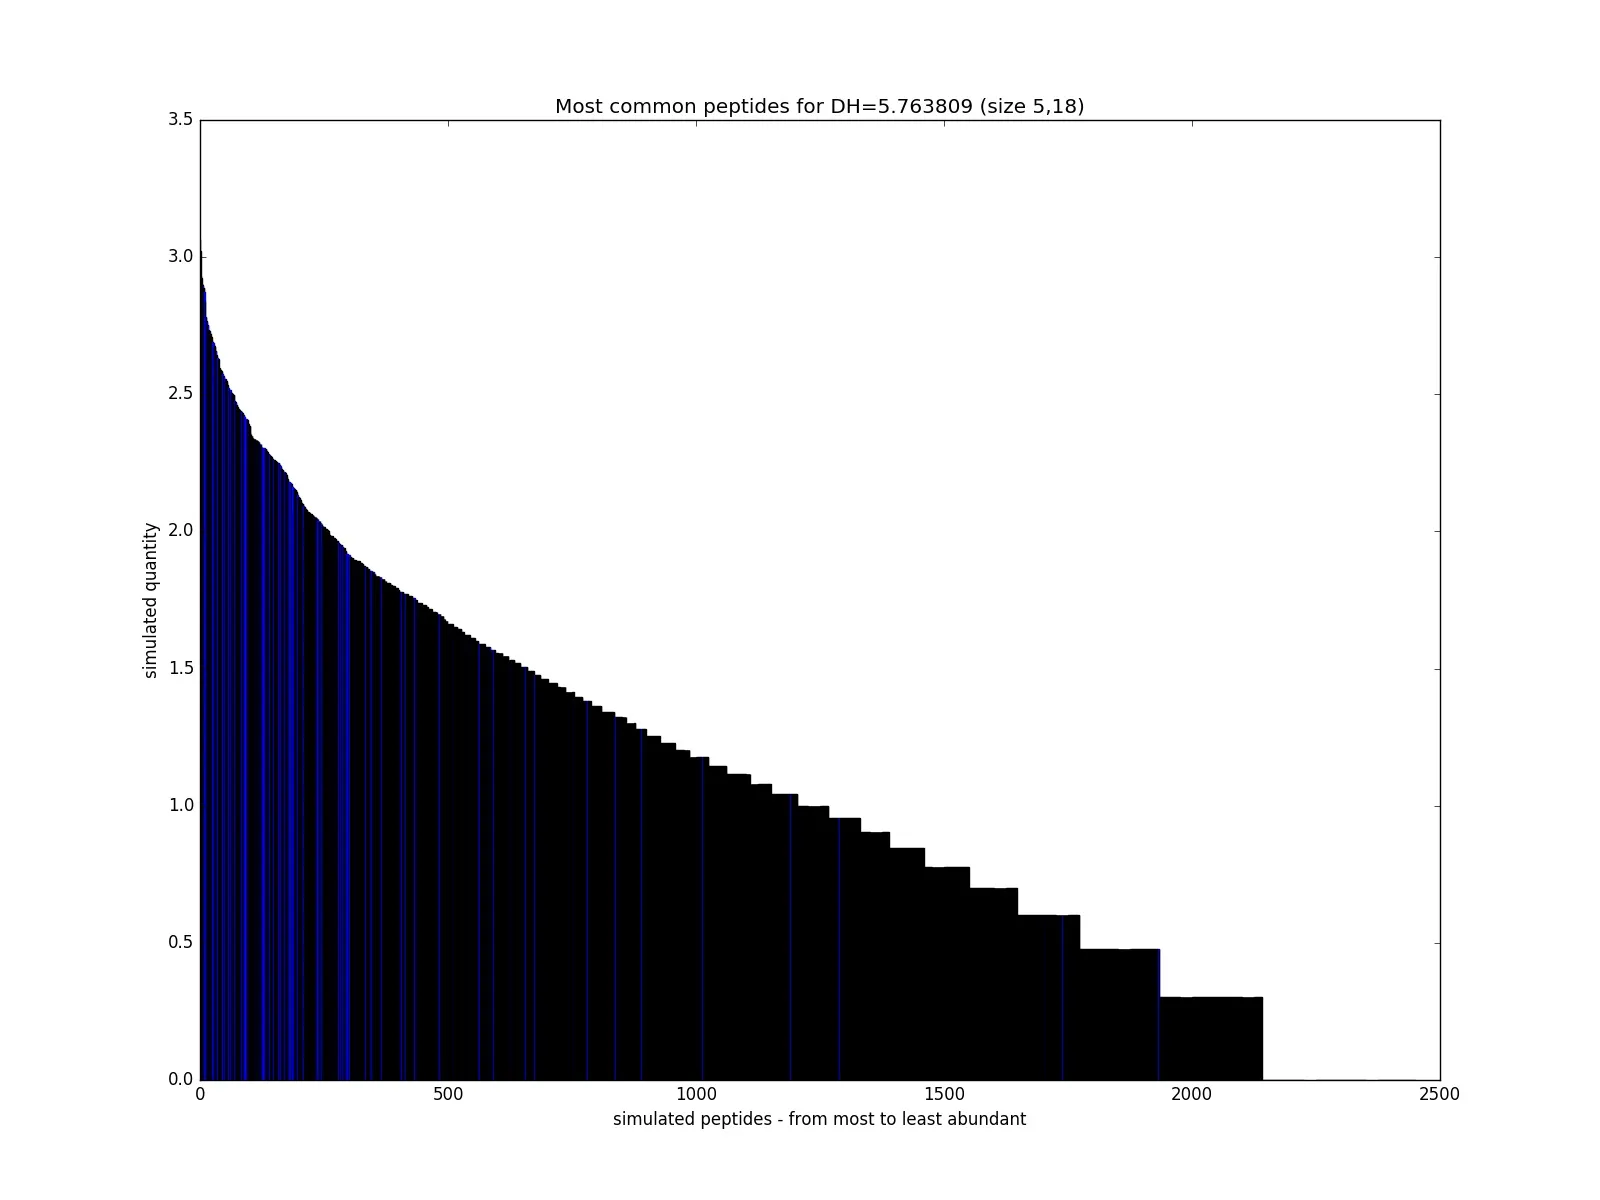 。
。如您所见,Y轴上有标签,我需要“获取”它们的文本。哪里出了错?
非常感谢您的帮助。
编辑:由于Mike Müller的答案,我设法使其工作。显然,在我的情况下,仅调用draw()是不够的,我必须在使用savefig()保存图形后获取值。这可能取决于matplotlib的版本,我正在运行1.5.1,而Mike正在运行1.5.0。我还将查看tcaswell建议的FuncFormatter。