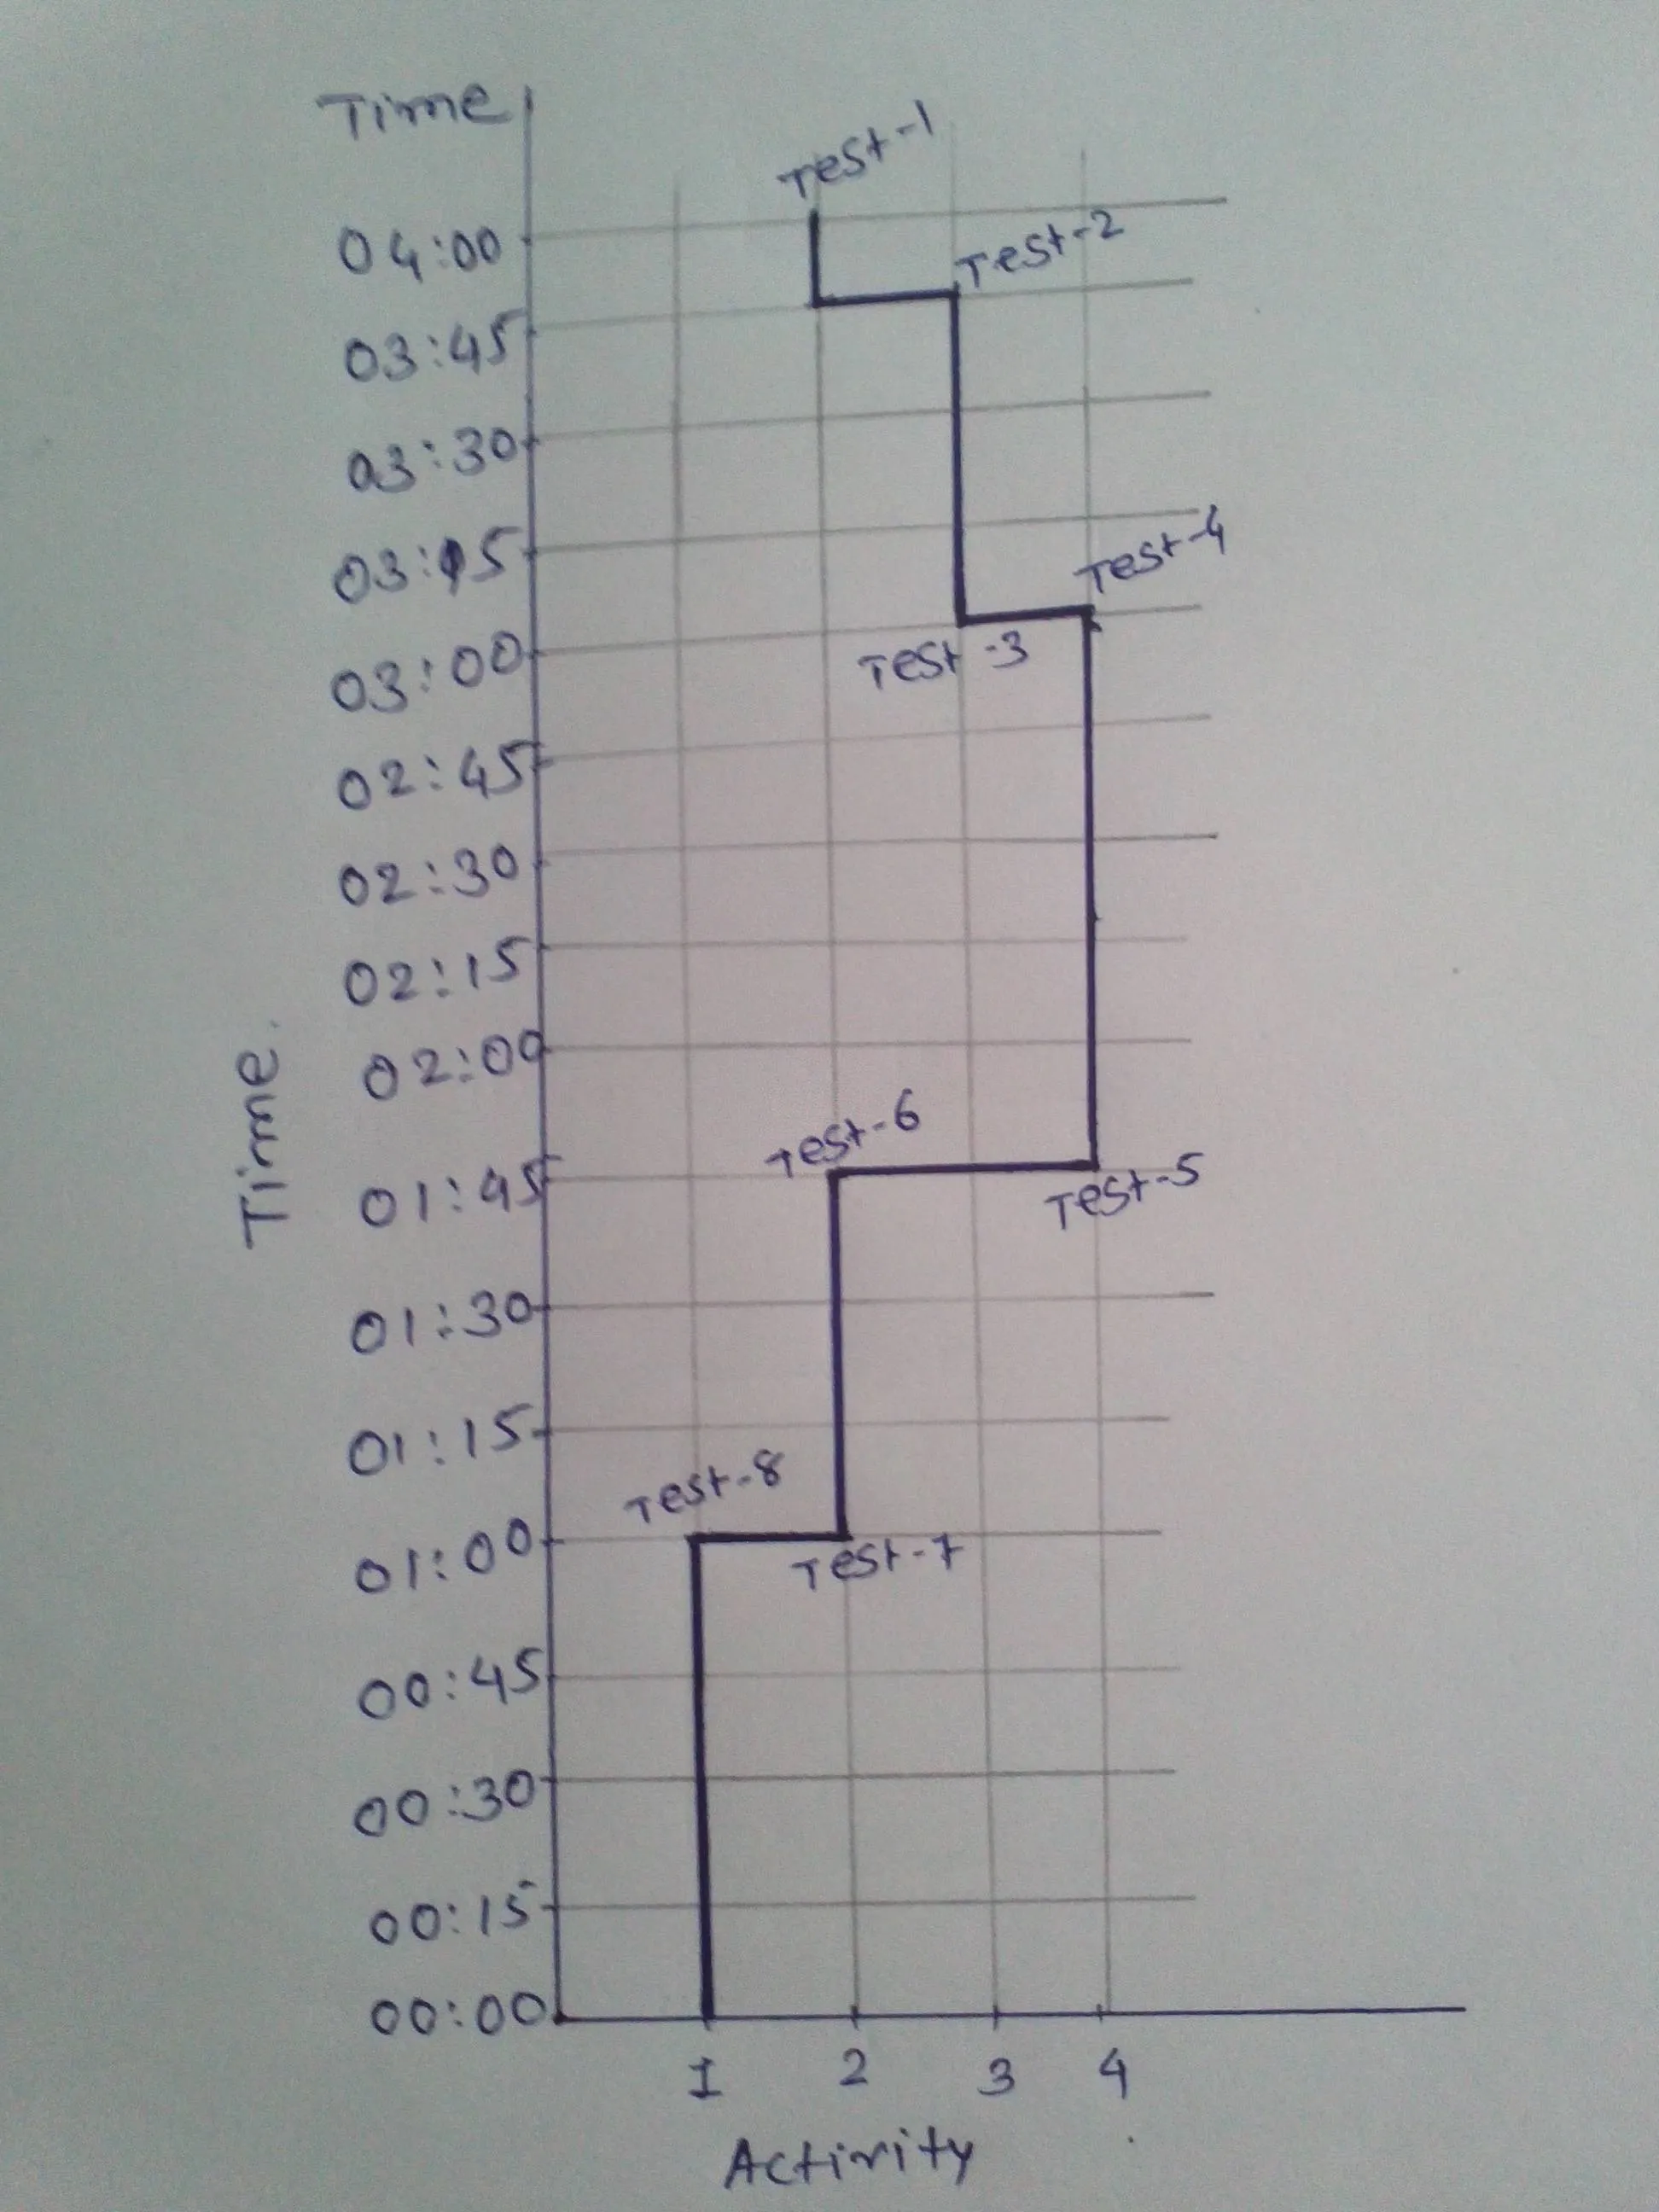
我想要绘制如附图所示的图表。
我已经尝试使用aChartEngine,但没有成功。
SurfaceView,在其中可以使用 onDraw() 方法绘制 Canvas。为了绘制您的图形,可以使用 Path 类以及它的 moveTo() 和 lineTo() 方法。使用 Paint 类来改变线条的外观。然后使用 Canvas 的 drawPath() 方法,该方法接受一个 Path 和一个 Paint 对象。我认为这比起使用 OpenGl 来说稍微容易一些。
更新: @Shakti Malik 发现了一个看起来相当不错且易于使用的库:MPAndroidChart
试试使用OpenGL ES如何?
你可以创建一个扩展GLSurfaceView的GraphView
示例代码-
public class GraphView extends GLSurfaceView {

private Renderer renderer;

public GraphView(Context context) {
    super(context);
    renderer = new GraphRenderer();
    setRenderer(renderer);
}
}
ublic class GraphRenderer implements Renderer {

public void onDrawFrame(GL10 gl) {
gl.glMatrixMode(GL10.GL_MODELVIEW);
gl.glLoadIdentity();

GLU.gluLookAt(gl, 0, 0, -5, 0f, 0f, 0f, 0f, 1.0f, 1.0f);
gl.glColor4f(1, 0, 0, .5f);
}

public void onSurfaceChanged(GL10 gl, int width, int height) {
gl.glViewport(0, 0, width, height);

float ratio = (float) width / height;
gl.glMatrixMode(GL10.GL_PROJECTION);
gl.glLoadIdentity();
gl.glFrustumf(-ratio, ratio, -1, 1, 3, 7);
}

public void onSurfaceCreated(GL10 gl, EGLConfig config) {

}

private void drawGraph(GL10 gl) {
gl.glLineWidth(1.0f);

// put your code here ..


}

public static int loadShader(int type, String shaderCode) {
int shader = GLES20.glCreateShader(type);
GLES20.glShaderSource(shader, shaderCode);
GLES20.glCompileShader(shader);
return shader;
}
您可以尝试这种方法。
Canvas + Paint 的示例代码:
在您的 XML 布局中:
<com.y30.histogramdisplay.GraphView
    android:id="@+id/histogram_view"
    android:layout_width="match_parent"
    android:layout_height="match_parent"
    android:background="@android:color/transparent" />
在Activity中:
protected void onCreate(Bundle savedInstanceState) {
   super.onCreate(savedInstanceState);
   setContentView(R.layout.activity_main);

   GraphView graphView = (GraphView)findViewById(R.id.histogram_view);
   int graphArray[] = new int[256];
   for(int i = 0; i < graphArray.length; ++i) {
       graphArray[i] = i % 50;
   }
   graphView.setGraphArray(graphArray);
}
还有新的视图:
public class GraphView extends View {

   int m_graphArray[] = null;
   int m_maxY = 0;

   Paint m_paint;


   public GraphView(Context context) {
       super(context);
       init();
   }

   public GraphView(Context context, AttributeSet attrs) {
       super(context, attrs);
       init();
   }

   public GraphView(Context context, AttributeSet attrs, int defStyle) {
       super(context, attrs, defStyle);
       init();
   }

   private void init() {
       m_paint = new Paint();
       m_paint.setColor(Color.BLUE);
       m_paint.setStrokeWidth(10);
   }

   public void setGraphArray(int Xi_graphArray[], int Xi_maxY)
   {
       m_graphArray = Xi_graphArray;
       m_maxY = Xi_maxY;
   }

   public void setGraphArray(int Xi_graphArray[])
   {
       int maxY = 0;
       for(int i = 0; i < Xi_graphArray.length; ++i)
       {
           if(Xi_graphArray[i] > maxY)
           {
               maxY = Xi_graphArray[i];
           }
       }
       setGraphArray(Xi_graphArray, maxY);
   }


   @Override
   protected void onDraw(Canvas canvas) {
       super.onDraw(canvas);

       if(m_graphArray == null)
       {
           return;
       }

       int maxX = m_graphArray.length;

       float factorX = getWidth() / (float)maxX;
       float factorY = getHeight() / (float)m_maxY;

       for(int i = 1; i < m_graphArray.length; ++i) {
           int x0 = i - 1;
           int y0 = m_graphArray[i-1];
           int x1 = i;
           int y1 = m_graphArray[i];

           int sx = (int)(x0 * factorX);
           int sy = getHeight() - (int)(y0* factorY);
           int ex = (int)(x1*factorX);
           int ey = getHeight() - (int)(y1* factorY);
           canvas.drawLine(sx, sy, ex, ey, m_paint);
        }
    }
 }
implementation 'com.jjoe64:graphview:4.2.1'
eduGrades = new String[5]; behGrades = new String[5];
eduGrades = 新的字符串[5]; behGrades = 新的字符串[5];
    eduGrades[0] = getString(R.string.fail);
    eduGrades[1] = getString(R.string.pass);
    eduGrades[2] = getString(R.string.good);
    eduGrades[3] = getString(R.string.very_good);
    eduGrades[4] = getString(R.string.excellent);

    behGrades[0] = getString(R.string.baad);
    behGrades[1] = getString(R.string.accepted);
    behGrades[2] =  getString(R.string.good);
    behGrades[3] =  getString(R.string.very_good);
    behGrades[4] =  getString(R.string.excellent);
创建DataPoint数组eduDp和behDp,长度为results.size()。
            dates = new String[results.size()];

            for (int i = 0; i < results.size(); i++) {

                dates[i] = results.get(i).getDateOfNote();

                eduDp[i] = new DataPoint(i, (double) results.get(i).getEducationEvaluationSign());
                behDp[i] = new DataPoint(i, (double) results.get(i).getBehaviorEvaluationSign());

            }

            LineGraphSeries<DataPoint> eduSeries = new LineGraphSeries<>(eduDp);
            educationalGraphView.addSeries(eduSeries);
            eduSeries.setDrawBackground(true);
            eduSeries.setColor(getResources().getColor(R.color.blue));
            eduSeries.setBackgroundColor(getResources().getColor(R.color.blue));
            StaticLabelsFormatter staticLabelsFormatter;
            staticLabelsFormatter = new StaticLabelsFormatter(educationalGraphView);
            staticLabelsFormatter.setVerticalLabels(eduGrades);
            staticLabelsFormatter.setHorizontalLabels(dates);

            educationalGraphView.getGridLabelRenderer().setHorizontalLabelsColor(getResources().getColor(R.color.colorPrimaryDark));
            educationalGraphView.getGridLabelRenderer().setVerticalLabelsColor(getResources().getColor(R.color.colorPrimaryDark));
            educationalGraphView.getGridLabelRenderer().setGridColor(getResources().getColor(R.color.white));
            educationalGraphView.getGridLabelRenderer().setHorizontalLabelsAngle(145);
            educationalGraphView.getGridLabelRenderer().setTextSize(23f);
            educationalGraphView.getGridLabelRenderer().setLabelsSpace(20);
            educationalGraphView.getGridLabelRenderer().setLabelFormatter(staticLabelsFormatter);