在R中绘制并填充类似棋盘的区域(及类似区域)

3
我需要一些关于如何在R中绘制二维图形并有效地填充它们的建议。 我需要可视化一些数学上的“奇怪现象”,例如Sierpiński垫或简单的棋盘 - 并获得类似以下效果的效果: enter image description hereenter image description here 我考虑使用复数来定义点,但仍没有明确的想法如何填充特定区域(例如用两种不同颜色)。

请查看第96页。 - marbel
如果你可以“绘制”某些东西,那么你就可以用颜色“多边形”填充它。 - Carl Witthoft
2
请看这里的Scrabble棋盘(答案2)http://stackoverflow.com/questions/21280738/setting-up-a-scrabble-game-in-r - Troy
2个回答

10

像这样吗?从表示您的数据的矩阵开始

mx <- matrix(rep(c(T, F), 5), nrow=3, ncol=3)
#      [,1]  [,2]  [,3]
# [1,]  TRUE FALSE  TRUE
# [2,] FALSE  TRUE FALSE
# [3,]  TRUE FALSE  TRUE         

然后融化/绘图:

library(reshape2)
library(ggplot2)
ggplot(melt(mx), aes(x=Var1, y=Var2, fill=value)) + geom_tile()

这是您要找的吗?

这是您想要的吗?


谢谢你,BrodieG!在我的问题中(请参见我的更新帖子),情况并不那么简单,但它给了我一个提示,即可以简单地分组这些点,以便使用ggplot2根据这个分组进行线条和填充。 - Marta Karas
@Marciszka,只要您有每个点的坐标并且可以将一个点标记为处于某种状态,您就应该能够做到这一点。此外,如果您有大型数据集,则可能需要使用geom_raster() - BrodieG

4

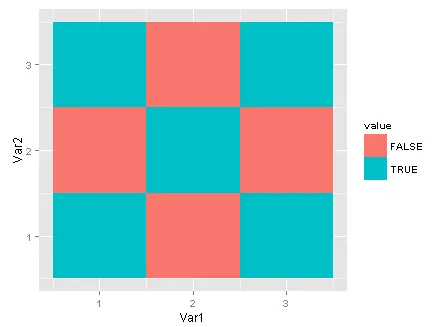
geom_raster() 对于形状相等的正方形瓷砖是最快的。

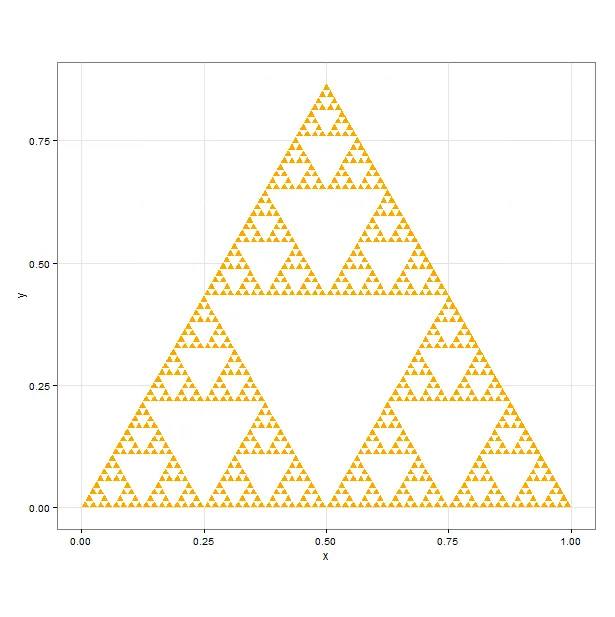
可能你需要使用 geom_polygon() - 这里是 Sierpinski:

记得使用 coord_fixed(ratio=1),否则形状比例会随着查看器的形状而缩放:

编辑 - 抱歉,意识到我没有给你 Sierpinski(不确定我当时在想什么)fixed

enter image description here

require(ggplot2)
require(reshape2)
t.h<-sin(2*pi/6)   # eq triangle unit height

sierpinski<-function(iter=3){
  n<-2^iter
  points<-ldply((n-1):0,function(x){
    data.frame(
      y=rep(n-x-1,x)*t.h/n,
      x=seq((from=(0.5/n)+(n-x)*(0.5/n)),by=1/n,length.out=x)
    )  
  })

  points$id<-1:nrow(points)

  rbind(
    points,
    points+matrix(c((t.h/n),(-0.5/n),0),nrow(points),ncol=3,byrow=T),
    points+matrix(c((t.h/n),(0.5/n),0),nrow(points),3,byrow=T)
  )
}

axiom<-data.frame(x=c(0,0.5,1),y=c(0,t.h,0))

iterations<-6

ggplot() + theme_bw() + coord_fixed(ratio=1) +
  geom_polygon(data=axiom,aes(x,y), fill="orange") + 
  lapply(1:iterations,function(x){
    geom_polygon(data=sierpinski(x),aes(x,y,group=id), fill="white")
  })

此外,使用这些非常精确的递归和序列模型时,你应该知道:有时ggplot提供的图像可能不完全符合你的期望。例如,如下所示的康托尔尘图:
使用ggplot(使用raster)可以看到,即使输出是高分辨率的,“腿”看起来也不一致,而你在数学上知道它们是一致的。如果你下载图像并缩放,你会看到底部的不一致之处。
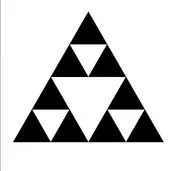
在下面的代码中,我展示了如何通过创建一个即时的原始png文件来生成精确的图片。如果你需要精度,请不要害怕这样做!原始图像生成的输出如下:
祝你好运!
# CANTOR

# NUMBER OF ROWS
n<-9

# MATRIX
m<-matrix(sapply(n:1,function(x){
    str.zero<-rep(0,3^(x-1))
    str.one<-rep(1,3^(x-1))
    rep(c(str.one,str.zero),length.out=3^(n-1))
}),nrow=n,byrow=T)

# CLEANUP
m.cantor<-apply(m,2,cumprod)    

# ggplot

ggplot(melt(m.cantor)) + theme_bw() +
  geom_raster(aes(x=Var2,y=-Var1,alpha=value),color="white")

# MAKE IMAGE FROM RAW DATA
# LIBRARIES REQUIRED
require(png)

# AT THE MOMENT WE HAVE A SHORT, WIDE MATRIX
dim(m.cantor)
# [1]    9 6561
# so let's scale it up say * 700 to make an approx square image (9 x 700 = 6300 ~ 6561)
# basically we're running through each row and replicating x 700
# then putting the pixels in a matrix with the new height (n=9 * 700) 
new.m<-matrix(sapply(1:n,function(x)rep(m.cantor[x,],700)),nrow=n*700,byrow=T)

dim(new.m) # check the size
#[1] 6300 6561       *  OK!

# then let's put it in raw image format
# png expects an array of 4 matrices, R,G,B and alpha

img.raw<-array(c((1-new.m), # R,G,B pixels oinverted so 1=shading
                 (1-new.m),   # no G
                 (1-new.m),   # no B
                 new.m^0    #note I'm putting this to ^0 to make all alphas 1
                 ),
               dim=c(dim(new.m),4))


writePNG(img.raw,"cantor.png")

网页内容由stack overflow 提供, 点击上面的
可以查看英文原文,
原文链接