调整xytext以避免重叠的注释

4

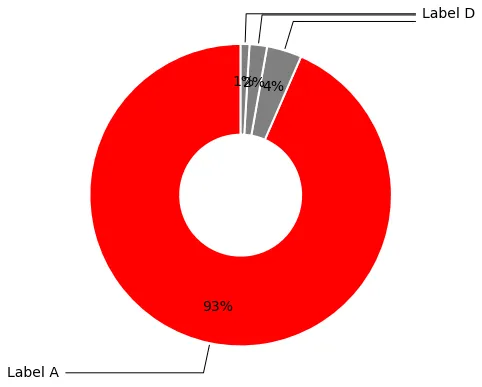
我有一些生成甜甜圈图的代码,但问题是由于数值的原因,有时注释会重叠。下面是代码和问题。

import pandas as pd
import numpy as np
import matplotlib.pyplot as plt

def donut_chart(val):

    df_vals = pd.DataFrame.from_dict(val, orient='index')
    labels = df_vals.index.tolist()

    fig, ax = plt.subplots(figsize=(6, 6), subplot_kw=dict(aspect="equal"))

    color = ['grey']*20
    color[0] = 'red'

    wedges, texts, junk = ax.pie(df_vals[0:4], counterclock = True, 
                            wedgeprops=dict(width=0.6, linewidth = 2, edgecolor = 'w'), 
                           startangle=90, colors=color,
                           autopct='%1.0f%%',
                           pctdistance=0.75,
                           textprops={'fontsize': 14})

    bbox_props = dict(boxstyle="square,pad=0.3", fc="w", ec="w", lw=0.72)
    kw = dict(xycoords='data', textcoords='data', arrowprops=dict(arrowstyle="-"),
              bbox=bbox_props, zorder=0, va="center")

    for i, p in enumerate(wedges):
        ang = (p.theta2 - p.theta1)/2. + p.theta1
        y = np.sin(np.deg2rad(ang))
        x = np.cos(np.deg2rad(ang))
        horizontalalignment = {-1: "right", 1: "left"}[int(np.sign(x))]
        connectionstyle = "angle,angleA=0,angleB={}".format(int(ang))
        kw["arrowprops"].update({"connectionstyle": connectionstyle})
        ax.annotate(labels[i], xy=(x, y), xytext=(1.2*np.sign(x), 1.2*y),
                     horizontalalignment=horizontalalignment, **kw, size=14)

    #centre_circle = plt.Circle((0,0),0.5, fc='white',linewidth=1.25)
    #fig.gca().add_artist(centre_circle)
    plt.axis('equal')
    plt.show()
    plt.close()


val = {'Label A':50, 'Label B':2, 'Label C':1, 'Label D':0.5}
donut_chart(val)

问题:

enter image description here

我希望创建类似于这样的东西:

enter image description here

关键似乎在于改变xytext中的y值,以便标签不重叠,但我卡在了如何实现这一点,甚至不确定是否可能。
有什么想法吗?
1个回答

2
更新后的代码
import pandas as pd
import numpy as np
import matplotlib.pyplot as plt

def donut_chart(val):

    df_vals = pd.DataFrame.from_dict(val, orient='index')
    labels = df_vals.index.tolist()

    fig, ax = plt.subplots(figsize=(6, 6), subplot_kw=dict(aspect="equal"))

    color = ['grey']*20
    color[0] = 'red'

    wedges, texts = ax.pie(df_vals[0:5], counterclock = True, 
                            wedgeprops=dict(width=0.6, linewidth = 1, edgecolor = 'w'), 
                           startangle=90, colors=color,
                           textprops={'fontsize': 14})

    bbox_props = dict(boxstyle="square,pad=0", fc="w", ec="w", lw=0.72)
    kw = dict(xycoords='data', textcoords='data', arrowprops=dict(arrowstyle="-"),
              bbox=bbox_props, zorder=0, va="center")

    for i, p in enumerate(wedges):
        ang = (p.theta2 - p.theta1)/2. + p.theta1
        y = np.sin(np.deg2rad(ang))
        x = np.cos(np.deg2rad(ang))
        horizontalalignment = {-1: "right", 1: "left"}[int(np.sign(x))]
        connectionstyle = "angle,angleA=0,angleB={}".format(int(ang))
        kw["arrowprops"].update({"connectionstyle": connectionstyle})
        ax.annotate(labels[i], xy=(x, y), xytext=((i/10) + 1.1*np.sign(x), (i/10) + y),
                     horizontalalignment=horizontalalignment, **kw, size=14)

    #centre_circle = plt.Circle((0,0),0.5, fc='white',linewidth=1.25)
    #fig.gca().add_artist(centre_circle)
    plt.axis('equal')
    plt.show()
    plt.close()
val = {'Label A':50, 'Label B':2, 'Label C':0.2, 'Label D':0.2,'Label E':0.2}
donut_chart(val)

"差异"
 ax.annotate(labels[i], xy=(x, y), xytext=((i/10) + 1.1*np.sign(x), (i/10) + y),
                     horizontalalignment=horizontalalignment, **kw, size=14)

This text translates to: "

output

"

网页内容由stack overflow 提供, 点击上面的
可以查看英文原文,
原文链接