你根本不需要这个while循环。下面的代码将会给你想要的输出结果;它能够找到所有局部最小值和局部最大值,分别存储在minm和maxm中。请注意:当你将其应用于大型数据集时,一定要先平滑信号,否则你将得到大量的极值。
import numpy as np
from scipy.signal import argrelextrema
import matplotlib.pyplot as plt
x = np.array([6, 3, 5, 2, 1, 4, 9, 7, 8])
y = np.array([2, 1, 3 ,5 ,3 ,9 ,8, 10, 7])
sortId = np.argsort(x)
x = x[sortId]
y = y[sortId]
plt.plot(x-1, y)
plt.show()
maxm = argrelextrema(y, np.greater)
minm = argrelextrema(y, np.less)
这比上面的while循环效率要高得多。
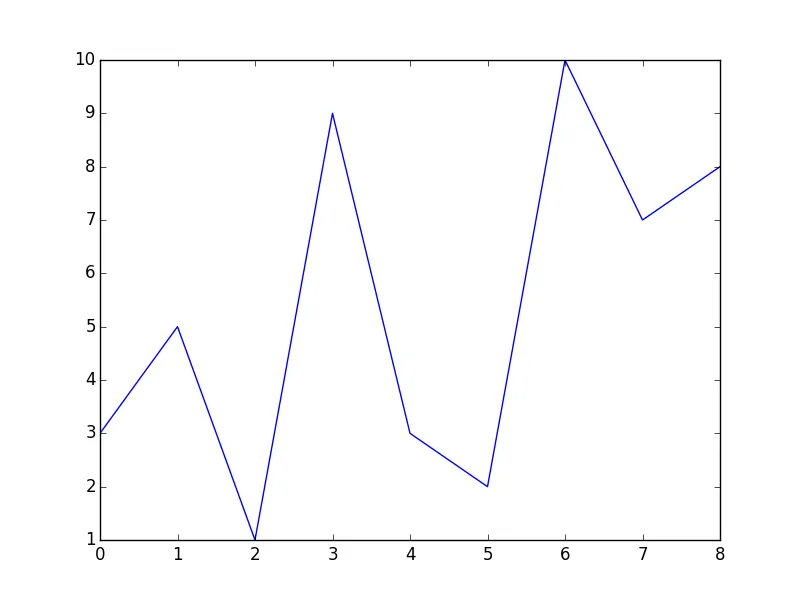
图像如下所示;我将x值移动,以使其对应于minm和maxm中返回的索引:
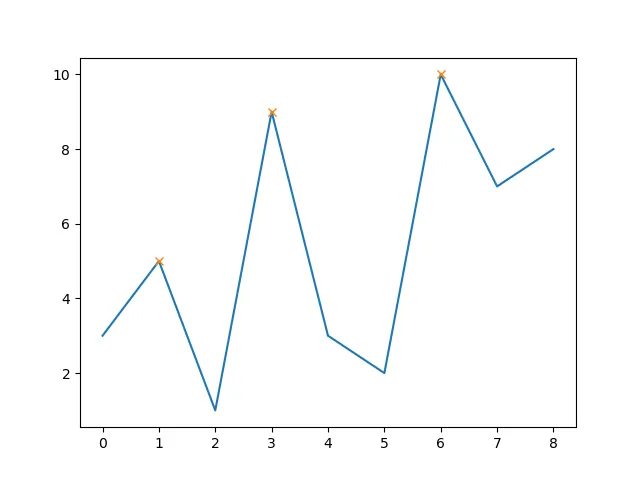
自SciPy版本1.1起,您还可以使用find_peaks:
from scipy.signal import find_peaks
peaks, _ = find_peaks(y)
plt.plot(x-1, y)
plt.plot(peaks, y[peaks], "x")
plt.show()
这将产生
好的一点是,现在你还可以轻松地设置最小峰值高度(例如8):
peaks, _ = find_peaks(y, height=8)
plt.plot(x-1, y)
plt.plot(peaks, y[peaks], "x")
plt.show()
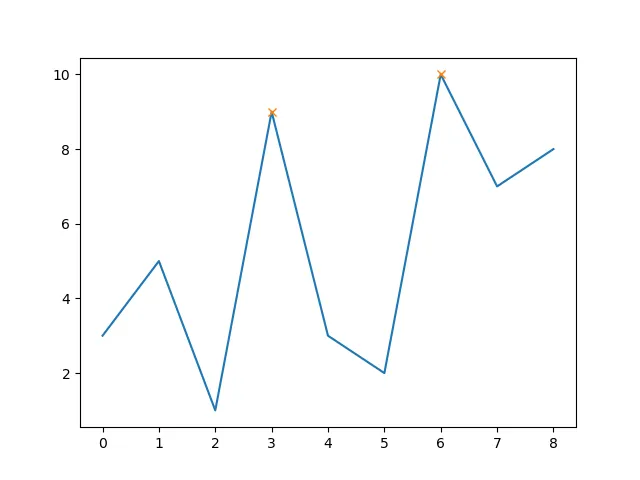
请注意,由于第一个峰的高度低于8,现在已经被去除。
此外,您还可以设置峰之间的最小距离(例如5):
peaks, _ = find_peaks(y, distance=5)
plt.plot(x-1, y)
plt.plot(peaks, y[peaks], "x")
plt.show()
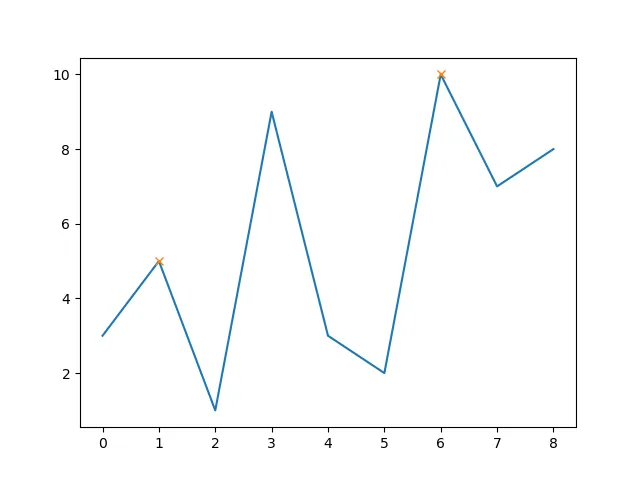
现在中间的峰被排除了,因为其到其他两个峰的距离小于5。
sortId=np.argsort(x); x=x[sortId]? - fferri