在R中绘制带有标准误差的曲线。

5

我需要绘制一条曲线,标准误差以阴影区域的形式呈现。例如,我有一个类似以下时间间隔的矩阵:

Age        CO2                 Standard_error
0   1                   1.42E-13
0.5 0.998268422989761   0.00169763164186241
1   0.995743963199747   0.00479900584235718
1.5 0.995062233834876   0.0103274581695151
2   1.00398569520812    0.0195262589284694
2.5 1.03116826950464    0.0329875314671063
3   1.07422916427453    0.049116358866183
3.5 1.11992125335082    0.0646007093291105
4   1.15670166266193    0.0770010287134558
4.5 1.18120894601468    0.0860204557092314
5   1.1972210240662 0.0930892044882256
5.5 1.21094781023761    0.0999899575457834
6   1.22407556599768    0.10698386874689
6.5 1.23264038072763    0.112706241640139
7   1.23471241147135    0.116401516372119
7.5 1.23341569261173    0.118772825620555
8   1.23279196992244    0.120901622556905
8.5 1.2346500417623 0.123408621016096
9   1.23831115917507    0.126316578608025
9.5 1.24201463025631    0.129312831831815

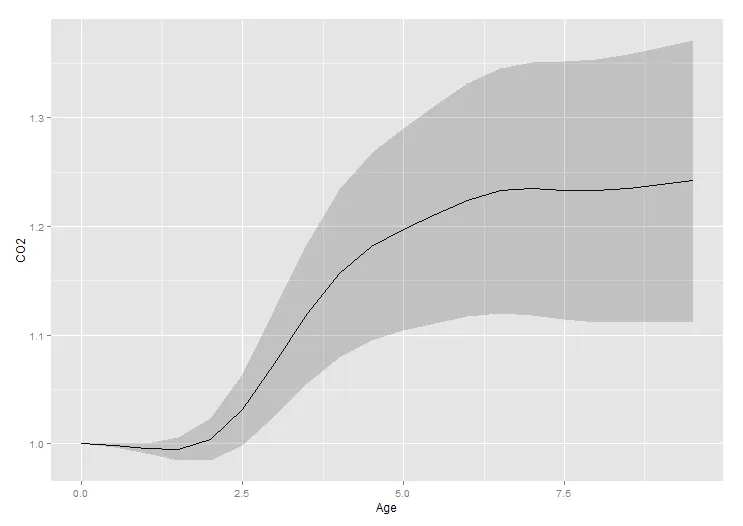
我希望可以利用估计的标准误差绘制曲线。大部分我所见过的函数(尤其是在ggplot2中)都会进行标准误差的预估,而我的数据已经被预估好了。

2个回答

10
你可以将ggplot2geom_ribbon结合使用:
library(ggplot2)
ggplot(dat, aes(x = Age, y = CO2)) +
       geom_line() +
       geom_ribbon(aes(ymin = CO2 - Standard_error,
                       ymax = CO2 + Standard_error), alpha = 0.2)

输入图像描述


做得好,@jeremycg!谢谢!! - user3660245

8

?matplot在基础R绘图中通常很方便用于这种任务:

matplot(
  dat$Age,
  dat$CO2 + outer(dat$Standard_error, c(0,1,-1)),
  type="l", lty=c(1,2,2), col=c(1,2,2),
  xlab="Age", ylab="CO2"
)

这里输入图片描述

如果遮蔽很重要,我会使用 polygon

ses <- dat$CO2 + outer(dat$Standard_error, c(1,-1))
with(dat, 
  plot(
    Age, CO2, type="l", ylim=range(ses),
    panel.first=polygon(c(Age,rev(Age)), c(ses[,1],rev(ses[,2])),border=NA, col="#ebebeb")
  )
)

enter image description here


网页内容由stack overflow 提供, 点击上面的
可以查看英文原文,
原文链接