当drop = FALSE时,ggplot2警告“删除了x行包含缺失值的数据”

3
我正在使用ggplot2创建一个并排柱状图。当使用
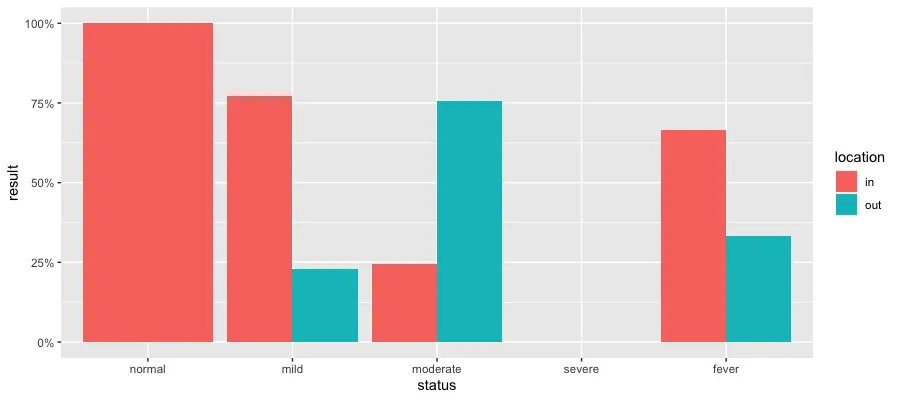
scale_x_discrete(drop = T)时,我的代码可以生成正确的图形。但是我有一个值为0的级别,并且我想在x轴上包含它。当我设置scale_x_discrete(drop = F)时,会出现警告:Removed x rows containing missing values (geom_bar). 并且另一个具有非零值的类别会被显示成零在绘图上。
以下是我的数据的示例:
library("tidyverse")

df <- data.frame(
  location = c(rep("in", 231), rep("out", 83)),
  status = c(rep("normal", 73), rep("mild", 42), rep("moderate", 20), rep("fever", 4),
             rep("normal", 70), rep("mild", 41), rep("moderate", 62), rep("fever", 2)))

df$status <- factor(df$status, levels = c("normal", "mild", "moderate", "severe", "fever"))


df %>%
  ggplot(aes(x = status,
             y = ..count../tapply(..count.., ..x.., sum)[..x..],
             fill = location)) +
  geom_bar(position = "dodge") +
  scale_y_continuous(labels = scales::percent) +
  scale_x_discrete(drop=F) +
  NULL

我已经看了很久,但是真的无法解决这个问题。

2个回答

3

无法解释非零值不绘制的原因。下面是使用dplyr的group_by函数的解决方案。

#calculate totals and then calculate the %
df %>% group_by(status, location) %>% summarise(value=n()) %>%   
  group_by(status) %>% mutate(result=value/sum(value)) %>%.      
  ggplot(aes(x = status,
             y = result,
             fill = location)) +
  geom_col(position = "dodge") +
  scale_y_continuous(labels = scales::percent) +
  scale_x_discrete(drop=F)

注意现在使用geom_col而不是geom_bar。 enter image description here

这是一个很好的解决方法,但我仍然不确定为什么我不能使用geom_bar来完成这个任务。在接受你的答案之前,我会等待看看是否有其他人能够回答我原始代码为什么无法工作的问题。 - Sam

2

你的代码无法运行,因为即使使用 drop = FALSE,缺失的类别仍然不会出现在 ..count....x.. 中。这可以通过绘制 ..count....x.. 来看到。

library("tidyverse")

df <- data.frame(
  location = c(rep("in", 231), rep("out", 83)),
  status = c(rep("normal", 73), rep("mild", 42), rep("moderate", 20), rep("fever", 4),
             rep("normal", 70), rep("mild", 41), rep("moderate", 62), rep("fever", 2)))

df$status <- factor(df$status, levels = c("normal", "mild", "moderate", "severe", "fever"))

Plot ..count..

df %>%
  ggplot(aes(x = status,
             y = ..count..,
             fill = location)) +
  geom_bar(position = "dodge") +
  scale_x_discrete(drop=F)

缺失的类别在“..count..”中不存在,我们可以从“normal”只出现一个值的事实推断出来,即“..count..”是向量。
..count.. <- c(143, 64, 19, 20, 62, 4, 2)

绘制 ..x..

df %>%
  ggplot(aes(x = status,
             y = ..x..,
             fill = location)) +
  geom_bar(position = "dodge") +
  scale_x_discrete(drop=F)

..count.. 一样,缺失的类别在 ..x.. 中也不存在,即 ..x.. 是一个向量。

..x.. <- c(1, 2, 2, 3, 3, 5, 5)

为什么代码不起作用

首先我计算tapply(..count.., ..x.., sum),它给我们一个长度为4的向量(非缺失状态类别的总计数):

tapply(..count.., ..x.., sum)
#>   1   2   3   5 
#> 143  83  82   6

现在,通过 [..x..] 提取元素会得到以下结果。
tapply(..count.., ..x.., sum)[..x..]
#>    1    2    2    3    3 <NA> <NA> 
#>  143   83   83   82   82   NA   NA

或者

..count.. / tapply(..count.., ..x.., sum)[..x..]
#>      1      2      2      3      3   <NA>   <NA> 
#> 1.0000 0.7711 0.2289 0.2439 0.7561     NA     NA

因此,您的代码在最后两个类别中产生了两个缺失值,这解释了警告Removed 2 rows containing missing values (geom_bar)。原因是使用..x.. <- c(1, 2, 2, 3, 3, 5, 5)我们尝试从长度为4的向量tapply(..count.., ..x.., sum)中提取两次第五个元素,因此返回NAs。

如果drop=TRUE,则一切正常,因为在这种情况下..x.. <- c(1, 2, 2, 3, 3, 4, 4)..count..相同。

解决方案

问题可以通过将..x..转换为字符向量来解决。在这种情况下,我们按名称提取元素:

library("tidyverse")

df <- data.frame(
  location = c(rep("in", 231), rep("out", 83)),
  status = c(rep("normal", 73), rep("mild", 42), rep("moderate", 20), rep("fever", 4),
             rep("normal", 70), rep("mild", 41), rep("moderate", 62), rep("fever", 2)))

df$status <- factor(df$status, levels = c("normal", "mild", "moderate", "severe", "fever"))

# Convert ..x.. to character
df %>%
  ggplot(aes(x = status,
             y = ..count.. / tapply(..count.., ..x.., sum)[as.character(..x..)],
             fill = location)) +
  geom_bar(position = "dodge") +
  scale_x_discrete(drop=F)

本文创建于2020年3月23日,使用的是reprex软件包(版本为v0.3.0)。

这个页面显示了一张图片,并告诉读者这篇文章是使用 reprex 软件包创建的,创建时间为2020年3月23日。

网页内容由stack overflow 提供, 点击上面的
可以查看英文原文,
原文链接