我正在尝试在Seaborn中显示同时包含均值和误差(kind="point")以及单个数据点(kind="swarm")的catplot叠加。
我有以下代码:
我有以下代码:
sns.catplot(x="Variable_A", y="Dependent_Variable", col="Variable_B", data=LRP_df, kind="swarm", color = "black")

sns.catplot(x="Variable_A", y="Dependent_Variable", col="Variable_B", data=LRP_df, kind="point", color = "red")

sns.despine()
这将分别生成两个图:
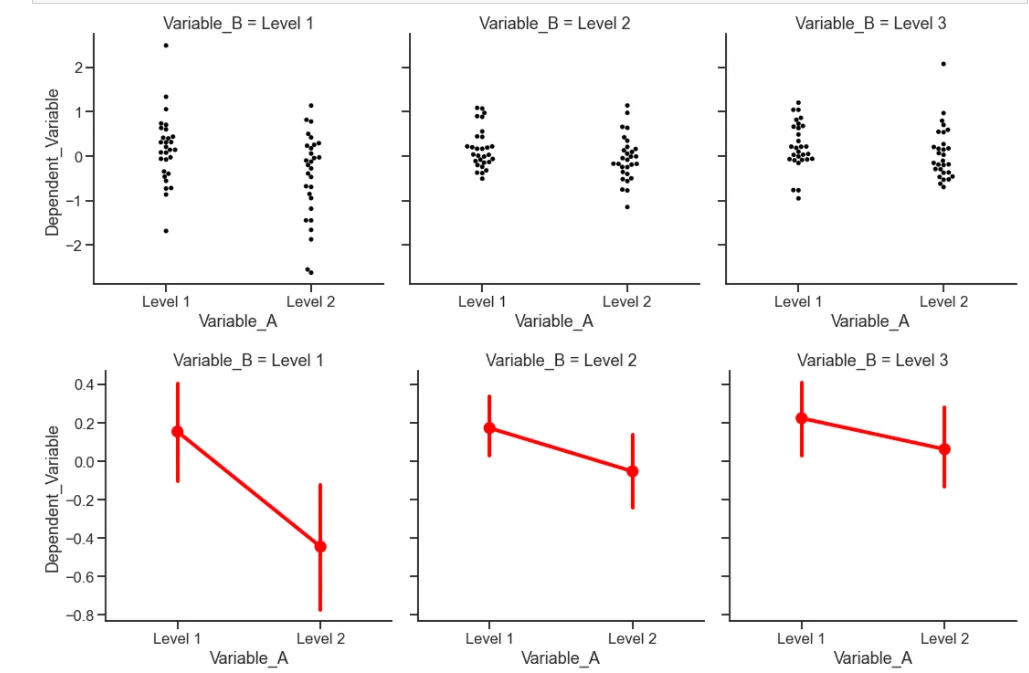
我该如何使这两个图放在同一坐标轴上?
谢谢!