我很难理解matplotlib,特别是轴设置方面的内容。我的目标是在一个图中设置6个子图,它们都显示不同的数据集,但具有相同数量的刻度标签。
我的源代码中与此相关的部分如下:
graph4.py:
# Import Matolotlib Modules #
import matplotlib as mpl
from matplotlib.figure import Figure
from matplotlib.backends.backend_gtkagg import FigureCanvasGTKAgg as FigureCanvas
from matplotlib import ticker
import matplotlib.pyplot as plt

mpl.rcParams['font.sans-serif']='Arial' #set font to arial

# Import GTK Modules #

import gtk

#Import System Modules #
import sys

# Import Numpy Modules #
from numpy import genfromtxt
import numpy

# Import Own Modules #
import mysubplot as mysp

class graph4():
    weekdays = ['Montag', 'Dienstag', 'Mittwoch', 'Donnerstag', 'Freitag', 'Samstag']

    def __init__(self, graphview):
        #create new Figure
        self.figure = Figure(figsize=(100,100), dpi=75)

        #create six subplots within self.figure
        self.subplot = []
        for j in range(6):
            self.subplot.append(self.figure.add_subplot(321 + j))


        self.__conf_subplots__() #configure title, xlabel, ylabel and grid of all subplots


        #to make it look better
        self.figure.subplots_adjust(left=0.125, bottom=0.1, right=0.9, top=0.96, wspace=0.2, hspace=0.6)

        #Matplotlib <-> GTK
        self.canvas = FigureCanvas(self.figure) # a gtk.DrawingArea
        self.canvas.set_flags(gtk.HAS_FOCUS|gtk.CAN_FOCUS)
        self.canvas.grab_focus()
        self.canvas.show()
        graphview.pack_start(self.canvas, True, True)


        #add labels and grid to all subplots
        def __conf_subplots__(self):
            index = 0
            for i in self.subplot:
                mysp.conf_subplot(i, 'Zeit', 'Menge', graph4.weekdays[index], True)
                i.plot([], [], 'bo') #empty plot
                index +=1


        def plot(self, filename_list):
            index = 0
            for filename in filename_list:
                data = genfromtxt(filename, delimiter=',') #load data from filename
                if data.size != 0: #only if file isn't empty
                    if index <= len(self.subplot): #plot every file on a different subplot
                        mysp.plot(self.subplot[index],data[0:, 1], data[0:, 0])
                        index +=1


            self.canvas.draw()


            def clear_plot(self):
                #clear axis of all subplots
                for i in self.subplot:
                    i.cla()

                self.__conf_subplots__()
mysubplot.py:(辅助模块)
# Import Matplotlib Modules
from matplotlib.axes import Subplot
import matplotlib.dates as md
import matplotlib.pyplot as plt

# Import Own Modules #
import mytime as myt

# Import Numpy Modules #
import numpy as np

def conf_subplot(subplot, xlabel, ylabel, title, grid):
    if(xlabel != None):
        subplot.set_xlabel(xlabel)
    if(ylabel != None):
        subplot.set_ylabel(ylabel)
    if(title != None):
        subplot.set_title(title)
    subplot.grid(grid)

    #rotate xaxis labels
    plt.setp(subplot.get_xticklabels(), rotation=30, fontsize=12)

    #display date on xaxis
    subplot.xaxis.set_major_formatter(md.DateFormatter('%H:%M:%S'))
    subplot.xaxis_date()


def plot(subplot, x, y):
    subplot.plot(x, y, 'bo')
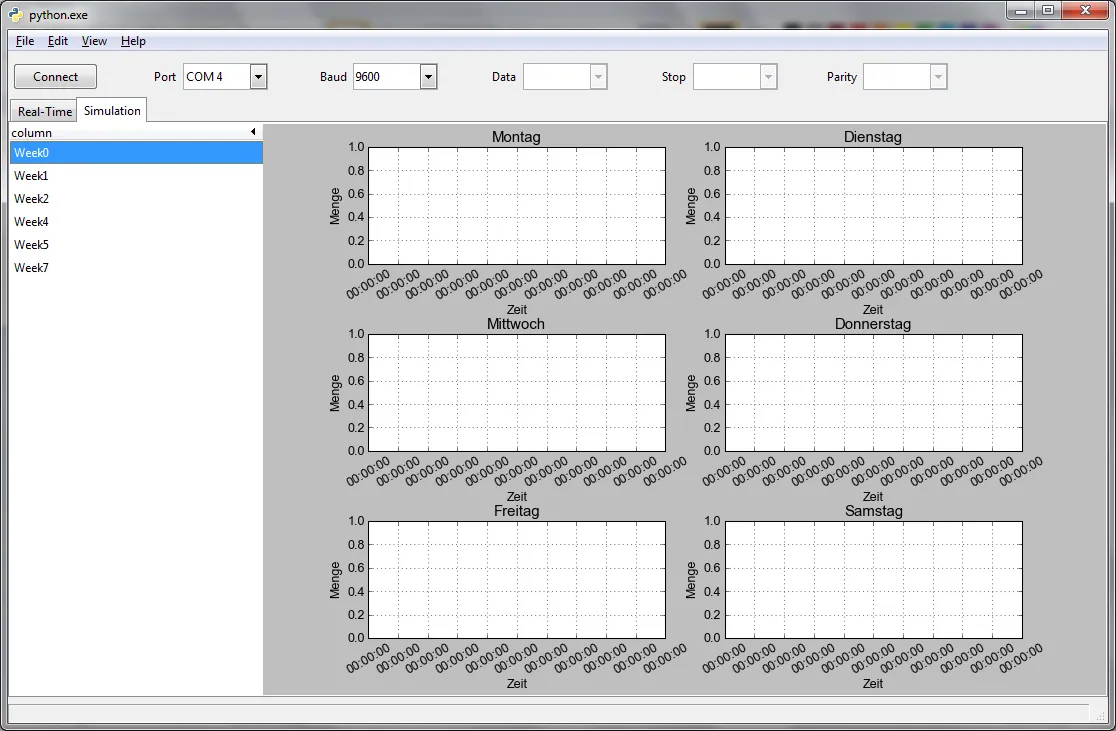
我认为解释发生了什么问题的最好方法是使用屏幕截图。当我启动我的应用程序后,一切都很正常:
 如果我在左侧双击一个“周”条目,则会调用graph4.py中的clear_plot()方法来重置所有子图。然后将文件名列表传递给graph4.py中的plot()方法。plot()方法打开每个文件并在不同的子图上绘制每个数据集。因此,在我双击条目之后,看起来像这样:
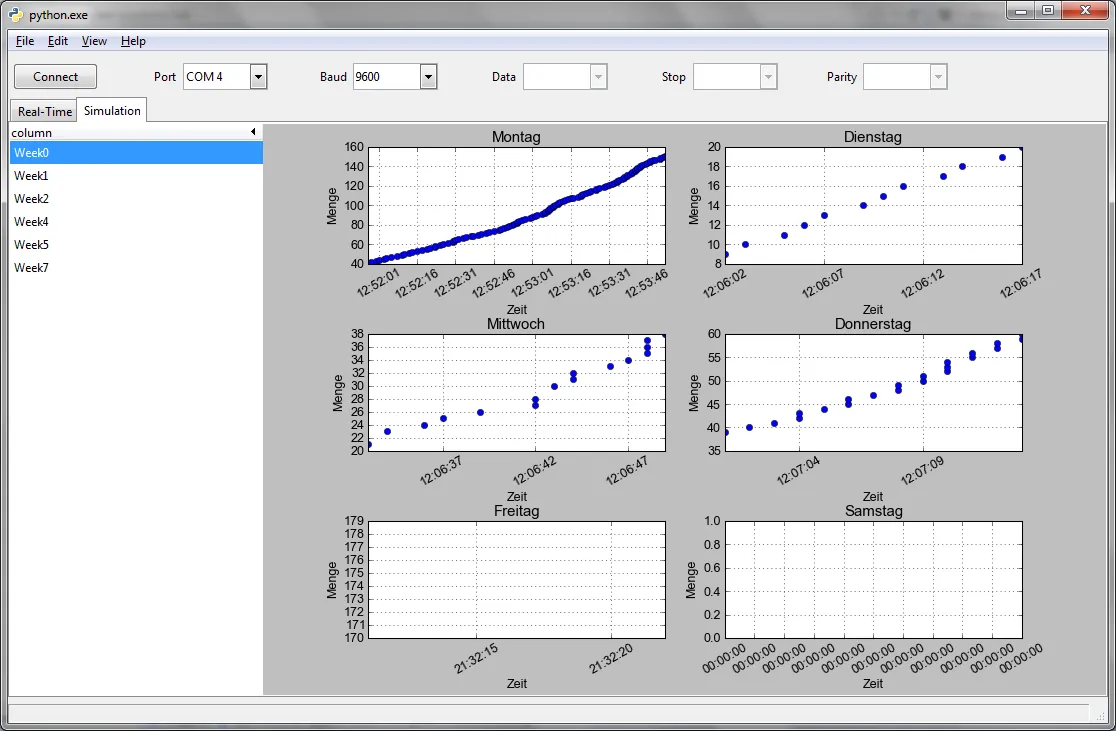 正如您所看到的,每个子图都有不同数量的xtick标签,这对我来说看起来相当丑陋。因此,我正在寻找改进这一点的解决方案。我的第一种方法是手动设置ticklabels,以便每个子图具有相同数量的ticklabels。但是,尽管听起来很奇怪,但这仅适用于某些数据集,我真的不知道为什么。对于某些数据集,一切正常,而对于其他数据集,matplotlib基本上在显示我没有指定的xaxis标签。我也尝试过FixedLocator(),但得到了相同的结果。在某些数据集上它可以工作,而在其他数据集上,matplotlib使用不同数量的xtick标签。
我做错了什么?
import matplotlib as mpl
import matplotlib.pyplot as plt
from matplotlib.backends.backend_gtkagg import FigureCanvasGTKAgg as FigureCanvas
import matplotlib.dates as md

mpl.rcParams['font.sans-serif']='Arial' #set font to arial

import gtk
import sys

# Import Numpy Modules #
from numpy import genfromtxt
import numpy

# Import Own Modules #
import mysubplot as mysp

class graph2():
    weekdays = ['Montag', 'Dienstag', 'Mittwoch', 'Donnerstag', 'Freitag', 'Samstag']

    def __init__(self, graphview):
        self.figure, temp = plt.subplots(ncols=2, nrows=3, sharex = True)

        #2d array -> list
        self.axes = [ y for x in temp for y in x]

        #axis: date
        for i in self.axes:
            i.xaxis.set_major_formatter(md.DateFormatter('%H:%M:%S'))
            i.xaxis_date()

        #make space and rotate xtick labels
        self.figure.autofmt_xdate()

        #Matplotlib <-> GTK
        self.canvas = FigureCanvas(self.figure) # a gtk.DrawingArea
        self.canvas.set_flags(gtk.HAS_FOCUS|gtk.CAN_FOCUS)
        self.canvas.grab_focus()
        self.canvas.show()
        graphview.pack_start(self.canvas, True, True)

    def plot(self, filename_list):
        index = 0
        for filename in filename_list:
            data = genfromtxt(filename, delimiter=',') #get dataset
            if data.size != 0: #only if file isn't empty
                if index < len(self.axes): #print each dataset on a different subplot
                    self.axes[index].plot(data[0:, 1], data[0:, 0], 'bo')
                    index +=1

        self.canvas.draw()

    #not yet implemented
    def clear_plot(self):
        pass
如果我绘制一些数据集,会得到如下输出:http://i.imgur.com/3ngYTNr.png(抱歉,我还没有足够的声望来嵌入图片)。
此外,我不确定共用x轴是否是一个好主意,因为每个子图中的x值可能不同(例如:在第一个子图中,x值范围从8:00am-11:00am,在第二个子图中,x值范围从7:00pm-9:00pm)。
如果我去掉
sharex = True,我会得到如下输出:http://i.imgur.com/rxHeSyJ.png(抱歉,我还没有足够的声望来嵌入图片)。
如您所见,现在的输出看起来更好了。但是,现在x轴上的标签没有更新。我认为这是因为最后几个子图是空的。
我的下一步尝试是为每个子图使用一个轴。因此,我进行了以下更改:
for i in self.axes:
    plt.setp(i.get_xticklabels(), visible=True, rotation = 30) #<-- I added this line...
    i.xaxis.set_major_formatter(md.DateFormatter('%H:%M:%S'))
    i.xaxis_date()

#self.figure.autofmt_xdate() #<--changed this line
self.figure.subplots_adjust(left=0.125, bottom=0.1, right=0.9, top=0.96, wspace=0.2, hspace=0.6) #<-- and added this line
现在我得到了以下输出:
i.imgur.com/TmA1goE.png(抱歉,我仍然没有足够的声望来嵌入图片)
所以,这次尝试中,我基本上与
Figure()和add_subplot()遇到了同样的问题。我真的不知道还能尝试什么才能让它工作...
subplots,它运行得非常好... - Saullo G. P. Castroax.locator_params(axis='x', nbins=6),应用于每个AxesSubplot。 - Saullo G. P. Castroax.locator_params(axis='x', nbins=6)似乎只能与sharex=True一起使用。如果我启用sharex属性,就会得到6个箱子,但是如果我禁用sharex,则Matplotlib会为每个子图使用不同数量的箱子。ax.locator_params(axis ='x',nbins = 6)另一个缺点似乎是我不能将其与ax.xaxis.set_major_formatter(md.DateFormatter('%H:%M:%S'))和ax.xaxis_date()结合使用。我总是会收到错误消息:'AutoDateLocator'object has no attribute'set_params'。如果我删除这两行,该错误消息就会消失,但现在日期没有绘制出来。 - user2494129