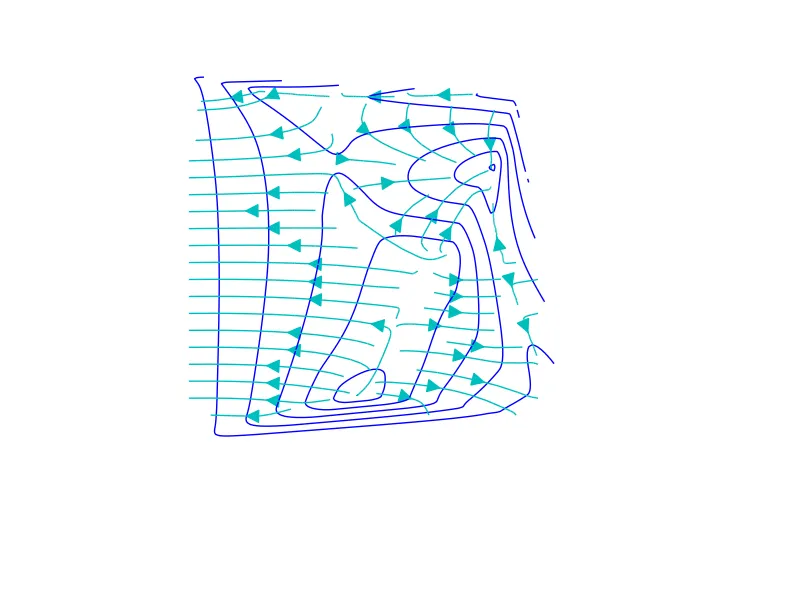
我正在使用matplotlib生成地下水位等高线和流线图。等高线表明许多区域的海拔正在降低,但是地下水流(流线图)指向上坡。我圈出了似乎指向错误方向的箭头。地图底部朝向的箭头似乎指向正确方向。有人知道可能是什么原因吗?
以下是生成此图的大部分代码:
以下是生成此图的大部分代码:
#create empty arrays to fill up!
x_values = []
y_values = []
z_values = []
#iterate over wells and fill the arrays with well data
for well in well_arr:
x_values.append(well['xpos'])
y_values.append(well['ypos'])
z_values.append(well['value'])
#initialize numpy array as required for interpolation functions
x = np.array(x_values, dtype=np.float)
y = np.array(y_values, dtype=np.float)
z = np.array(z_values, dtype=np.float)
#create a list of x, y coordinate tuples
points = zip(x, y)
#create a grid on which to interpolate data
xi, yi = np.linspace(0, image['width'], image['width']),
np.linspace(0, image['height'], image['height'])
xi, yi = np.meshgrid(xi, yi)
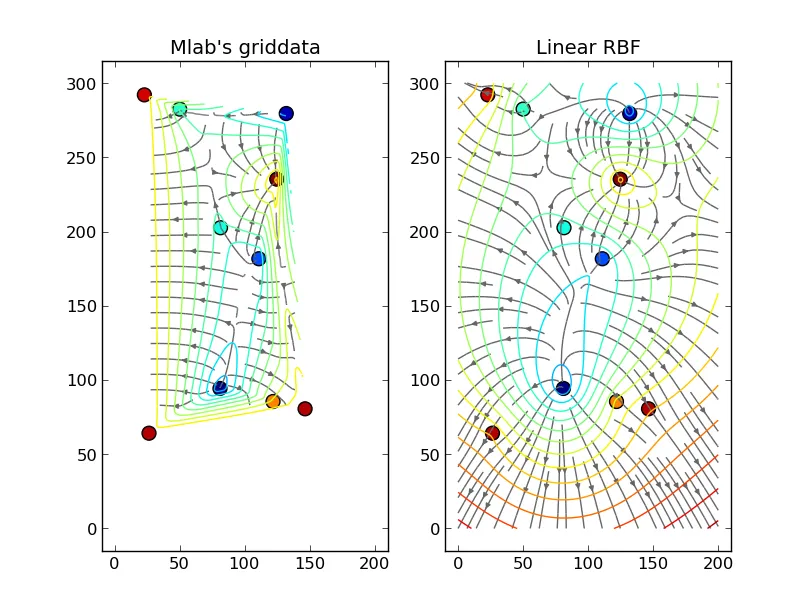
#interpolate the data with the matlab griddata function
zi = griddata(x, y, z, xi, yi, interp='nn')
#create a matplotlib figure and adjust the width and heights
fig = plt.figure(figsize=(image['width']/72, image['height']/72))
#create a single subplot, just takes over the whole figure if only one is specified
ax = fig.add_subplot(111, frameon=False, xticks=[], yticks=[])
#create the contours
kwargs = {}
if groundwater_contours:
kwargs['colors'] = 'b'
CS = plt.contour(xi, yi, zi, linewidths=linewidth, **kwargs)
#add a streamplot
dx, dy = np.gradient(zi)
plt.streamplot(xi, yi, dx, dy, color='c', density=1, arrowsize=3)
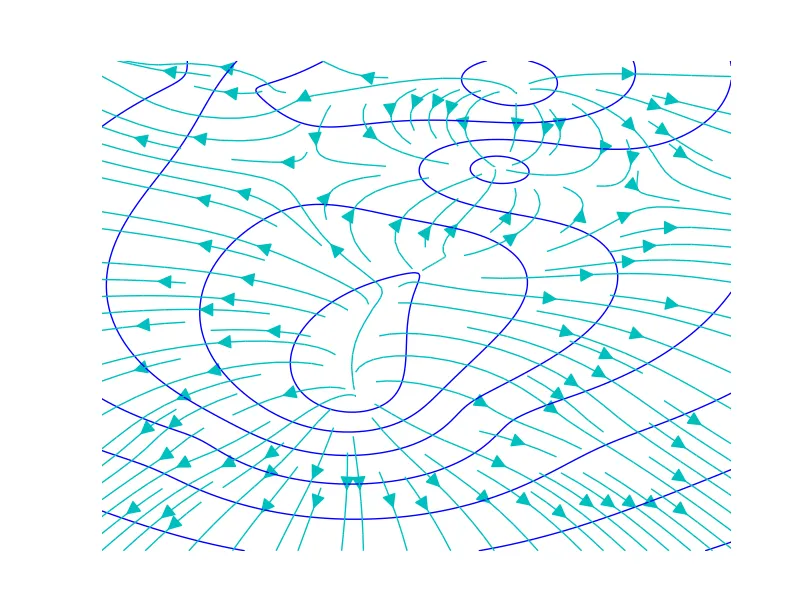
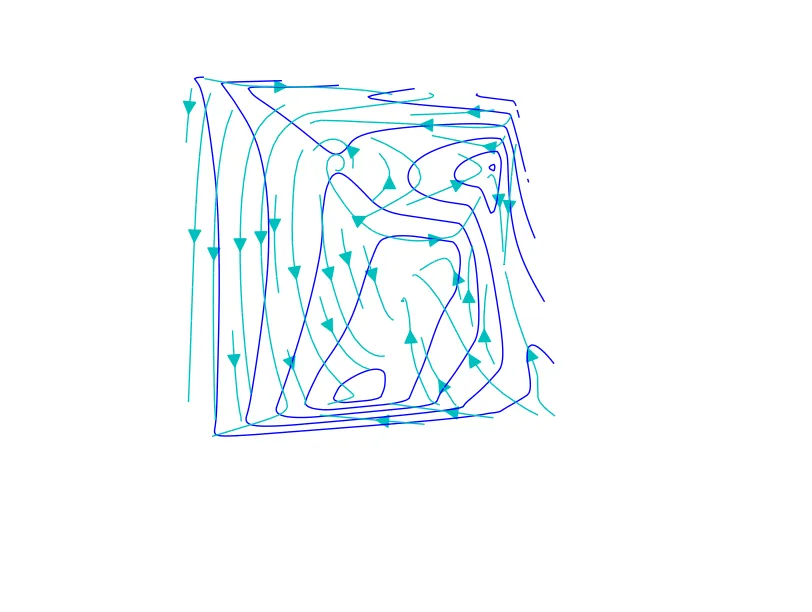 请注意,有很多地方流线不垂直于等值线。这比箭头朝向错误更容易指示出问题。(尽管“垂直”假定绘图的宽高比为1,但这对这些图而言并不完全正确,除非您进行设置。)