我已经在R中创建了一棵决策树模型。目标变量是薪资,我们试图基于其他输入变量来预测一个人的薪资是否高于或低于50k。
df<-salary.data

train = sample(1:nrow(df), nrow(df)/2)
train = sample(1:nrow(df), size=0.2*nrow(df))
test = - train
training_data = df[train, ]
testing_data = df[test, ]

fit <- rpart(training_data$INCOME ~ ., method="class", data=training_data)##generate tree
testing_data$predictionsOutput = predict(fit, newdata=testing_data, type="class")##make prediction
接下来我尝试通过以下步骤创建增益图
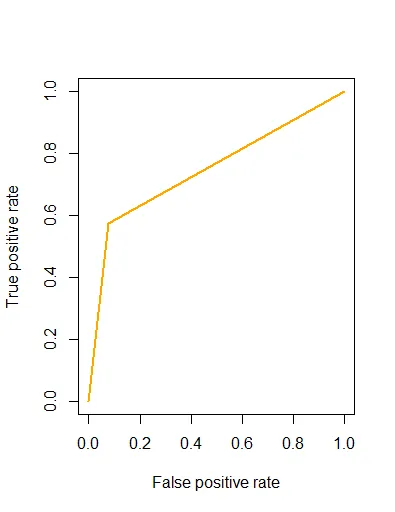
# Gain Chart
pred <- prediction(testing_data$predictionsOutput, testing_data$INCOME)
gain <- performance(pred,"tpr","fpr")
plot(gain, col="orange", lwd=2)
通过查看参考文献,我无法理解如何使用ROCR包来使用'Prediction'函数构建图表。这仅适用于二进制目标变量吗?我遇到了“预测格式无效”的错误。
如果有任何帮助,将不胜感激,以帮助我为上述模型构建增益图。谢谢!
  AGE          EMPLOYER     DEGREE             MSTATUS            JOBTYPE     SEX C.GAIN C.LOSS HOURS
1  39         State-gov  Bachelors       Never-married       Adm-clerical    Male   2174      0    40
2  50  Self-emp-not-inc  Bachelors  Married-civ-spouse    Exec-managerial    Male      0      0    13
3  38           Private    HS-grad            Divorced  Handlers-cleaners    Male      0      0    40

         COUNTRY INCOME
1  United-States  <=50K
2  United-States  <=50K
3  United-States  <=50K
目前,ROCR仅支持二元分类...如果存在两个以上的不同标签符号,则执行会停止并显示错误消息。- jlhowardprediction函数的第二个参数必须只有两个值。testing_data$INCOME是否只有两个值? - jlhowardsalary.data吗?请在你的问题中发布dput(salary.data)的输出,或者如果它太大了,请将其上传到某个地方并发布链接。 - jlhoward