这里是数据集:
https://www.dropbox.com/s/mrlfnh6e2ww1xwd/home.csv?dl=0
这是我的代码:
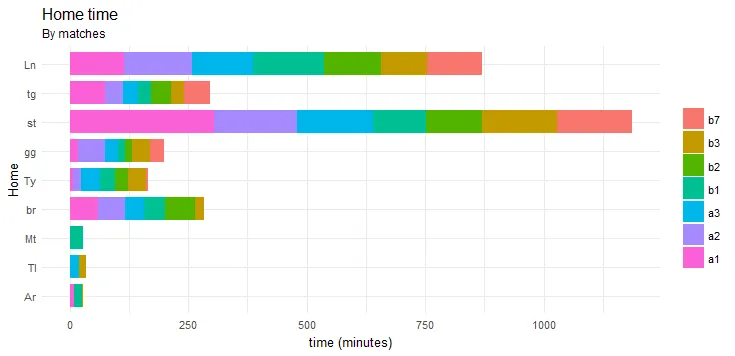
这里是输出结果:
hom <- read.csv(file.choose(),header=TRUE)
home.melt <- melt(hom, id.vars='home')

ggplot(home.melt,
aes(x = reorder(home, value), y = value,
fill=forcats::fct_rev(variable))) +
geom_bar(stat = "identity",width = 0.8) + coord_flip() +
theme_minimal(base_size=10) +
labs(title="Home time",
   subtitle="By matches",
   x="Home",
   y="time (minutes)",
   fill=" ")
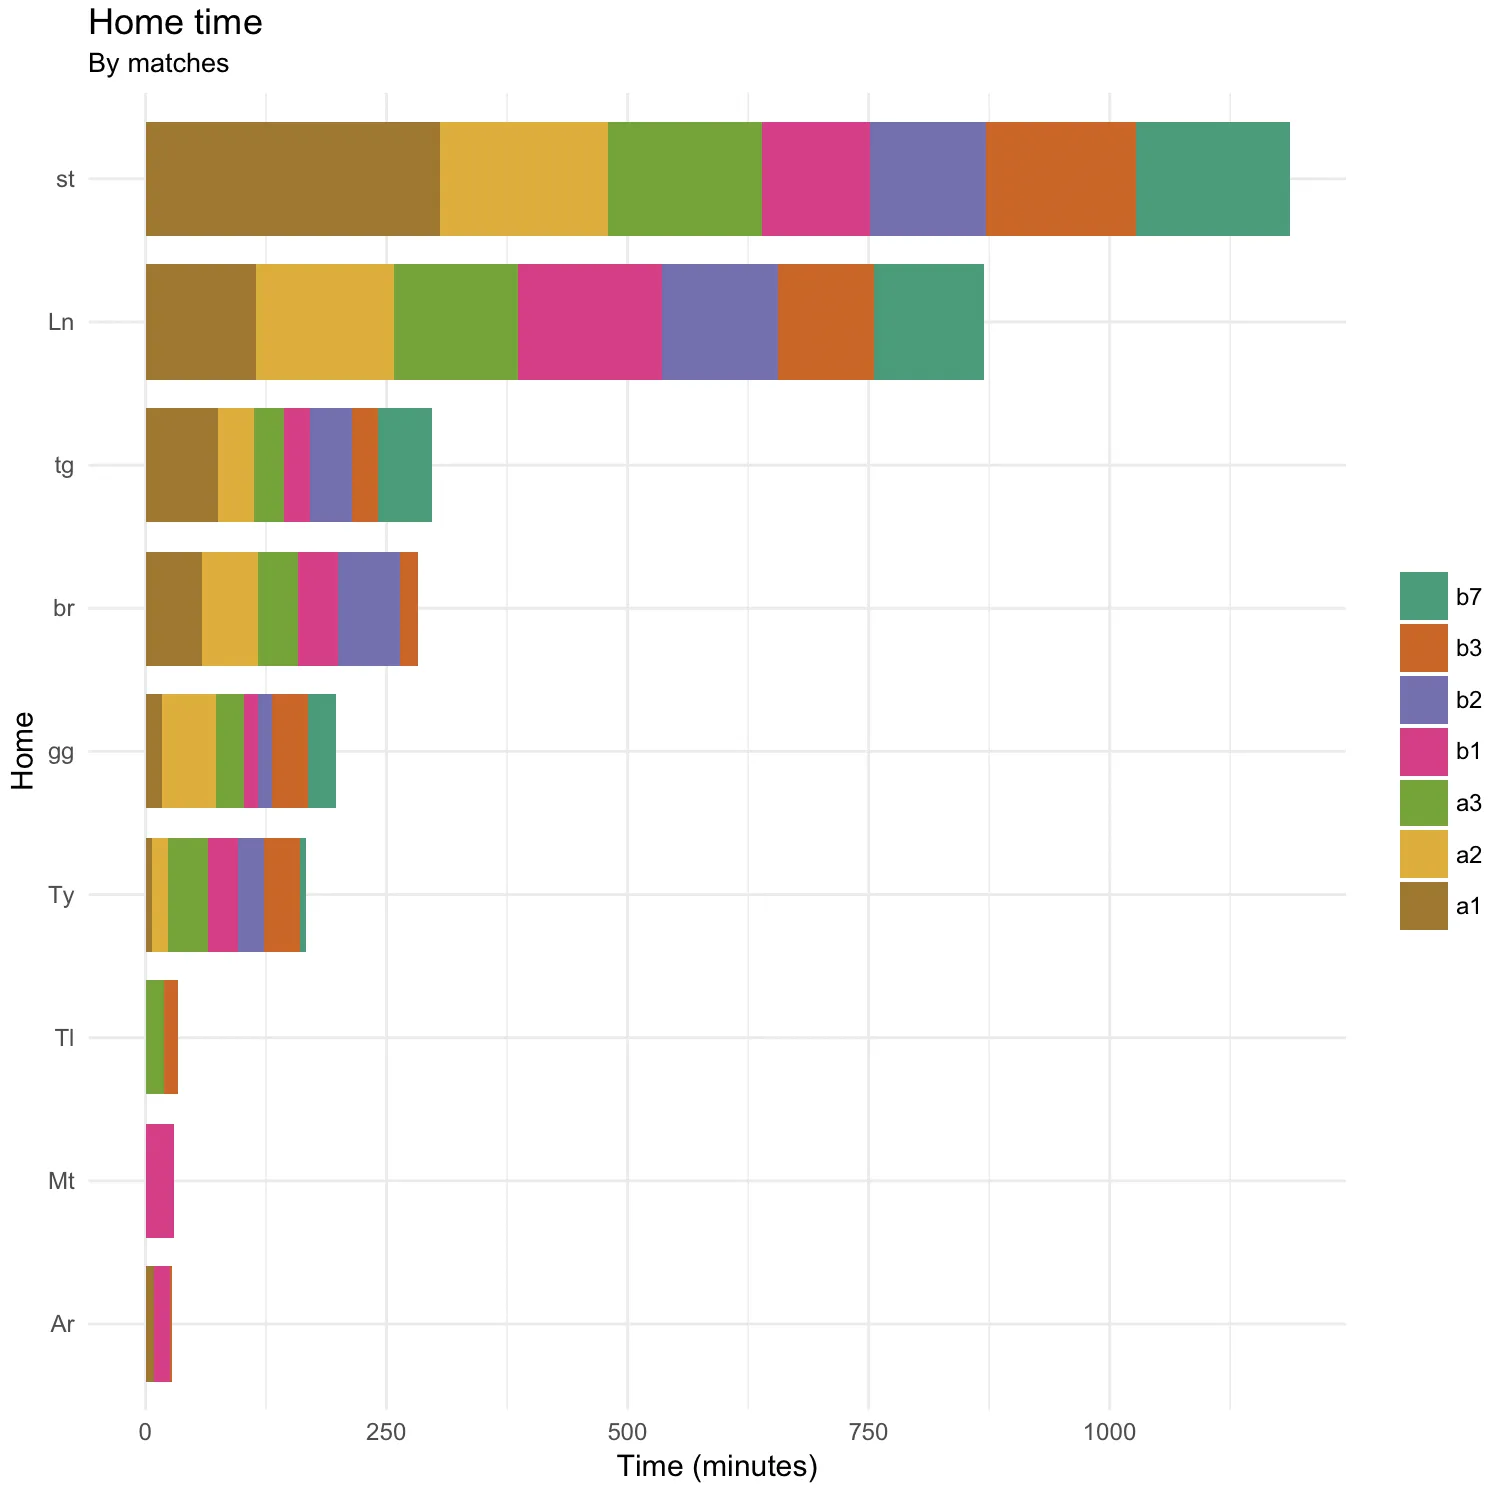
这里是输出结果: