在Matlab中以与R的bs()函数相同的方式计算B样条基函数

6

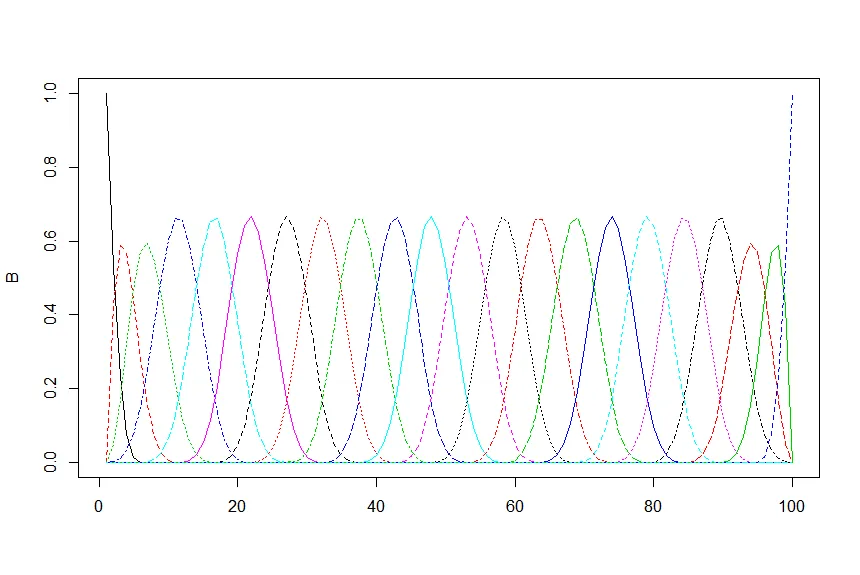
我正在寻找(最好是内置的)Matlab函数,以与R中相同的方式计算B样条基矩阵,例如对于具有20个等距节点和3次的样条基,我在R中会这样做:

require(splines)
B = bs(x = seq(0,1,length.out=100),
        knots = seq(0, 1, length.out=20), # 20 knots
        degree = 3,
        intercept = FALSE)
matplot(B,type="l")

enter image description here

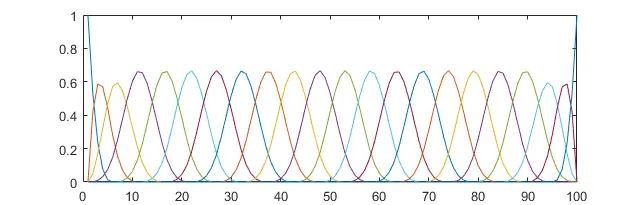
为了在Matlab中得到相同的结果,我认为可以使用

B = spcol(linspace(0,1,20),3,linspace(0,1,100));
plot(B);

在这里输入图片描述

但是可以看到边界结点缺失了。 有没有想法,在Matlab中获得与R相同的等效语法?

PS R用于bs()的代码略有简化:

basis <- function(x, degree, i, knots) {
  if(degree == 0){
    B <- ifelse((x >= knots[i]) & (x < knots[i+1]), 1, 0)
  } else {
    if((knots[degree+i] - knots[i]) == 0) {
      alpha1 <- 0
    } else {
      alpha1 <- (x - knots[i])/(knots[degree+i] - knots[i])
    }
    if((knots[i+degree+1] - knots[i+1]) == 0) {
      alpha2 <- 0
    } else {
      alpha2 <- (knots[i+degree+1] - x)/(knots[i+degree+1] - knots[i+1])
    }
    B <- alpha1*basis(x, (degree-1), i, knots) + alpha2*basis(x, (degree-1), (i+1), knots)
  }
  return(B)
}

bs <- function(x, degree=3, interior.knots=NULL, intercept=FALSE, Boundary.knots = c(0,1)) {
  if(missing(x)) stop("You must provide x")
  if(degree < 1) stop("The spline degree must be at least 1")
  Boundary.knots <- sort(Boundary.knots)
  interior.knots.sorted <- NULL
  if(!is.null(interior.knots)) interior.knots.sorted <- sort(interior.knots)
  knots <- c(rep(Boundary.knots[1], (degree+1)), interior.knots.sorted, rep(Boundary.knots[2], (degree+1)))
  K <- length(interior.knots) + degree + 1
  B.mat <- matrix(0,length(x),K)
  for(j in 1:K) B.mat[,j] <- basis(x, degree, j, knots)
  if(any(x == Boundary.knots[2])) B.mat[x == Boundary.knots[2], K] <- 1
  if(intercept == FALSE) {
    return(B.mat[,-1])
  } else {
    return(B.mat)
  }
}
1个回答

9

您的代码存在两个问题

  1. I think there is some confusion here between degree and order. You correctly specified degree=3 in your R code, but in MATLAB the argument passed to spcol is the order of the spline. In general, a spline function of order n is a piecewise polynomial of degree n-1. [1]

    Because MATLAB's spcol accepts the order as an input, you need to specify order=4 rather than what you thought you'd done which is degree=3! You generated a quadratic spline in MATLAB, and a cubic spline in R.

  2. It looks like the end knots in your R plot have non-singular multiplicity, by which I mean they are repeated. Making the end-points have multiplicity of degree+1 (in our case 4) means that their positions coincide with the control polygon, these are known as clamped knots. [2]

    In the R documentation for bs it states that the knots array contains the internal breakpoints. It looks like the boundary knots are defined to be clamped in your longer code sample, since they are repeated degree+1 times, on this line:

    knots <- c(rep(Boundary.knots[1], (degree+1)), interior.knots.sorted, rep(Boundary.knots[2], (degree+1)))
    

    This makes sense for clamped end-points, and backs up the earlier point about the use of the degree input.

    So our knots vector (with clamped end-points) in MATLAB should be:

    k = [0, 0, 0, linspace(0,1,20), 1, 1, 1]
    

结论

让我们使用4阶,以及一个末端带夹紧的节点向量:

B = spcol([0, 0, 0, linspace(0,1,20), 1, 1, 1], 4, linspace(0,1,100)); 
plot(B);

现在,我们可以看到边界节点,就像在 R 图中一样,并且由于三次夹紧节点的影响,每端还有两个更小的峰。


进一步阅读

[1]: 维基百科关于 B 样条的页面

[2]: MIT 的有用页面,更深入地描述了夹紧节点和数学知识。

b spline basis MATLAB


网页内容由stack overflow 提供, 点击上面的
可以查看英文原文,
原文链接