我正在尝试开发一个能够检测道路上车道的程序。我已经尝试过Hough线变换和概率Hough线变换,但是都没有得到我想要的结果。
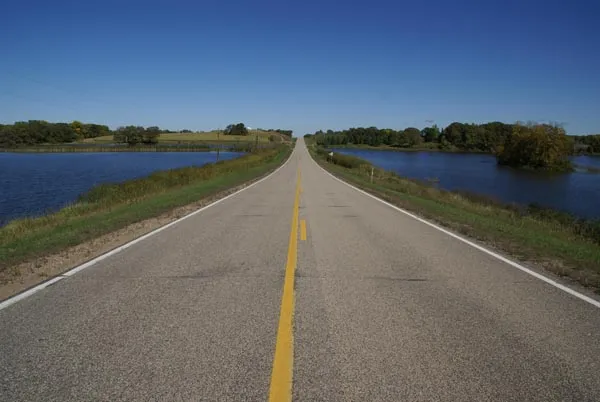
原始图像:
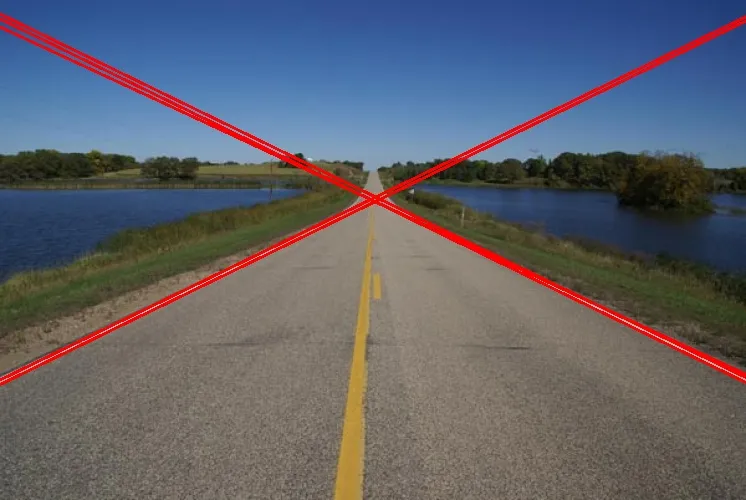
霍夫线变换
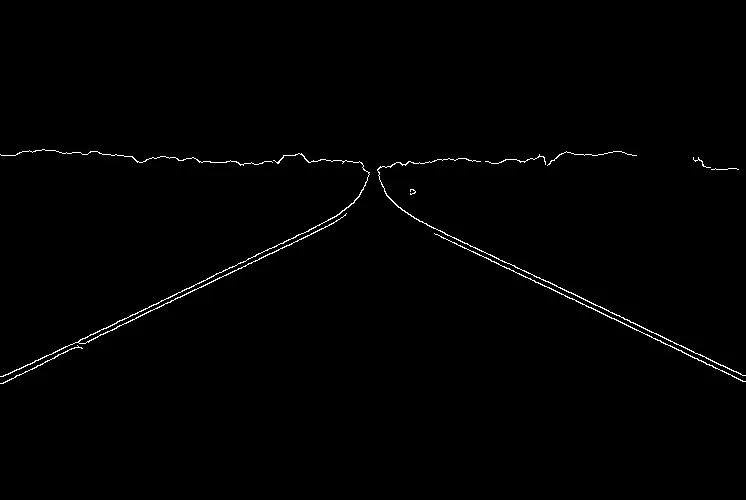
概率霍夫变换
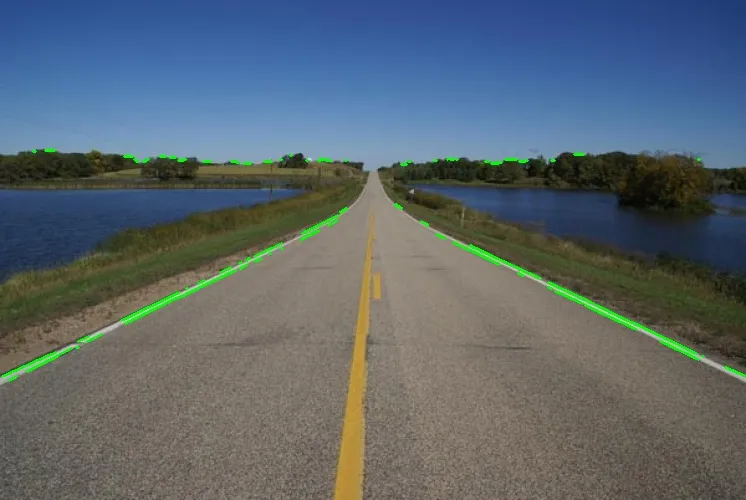

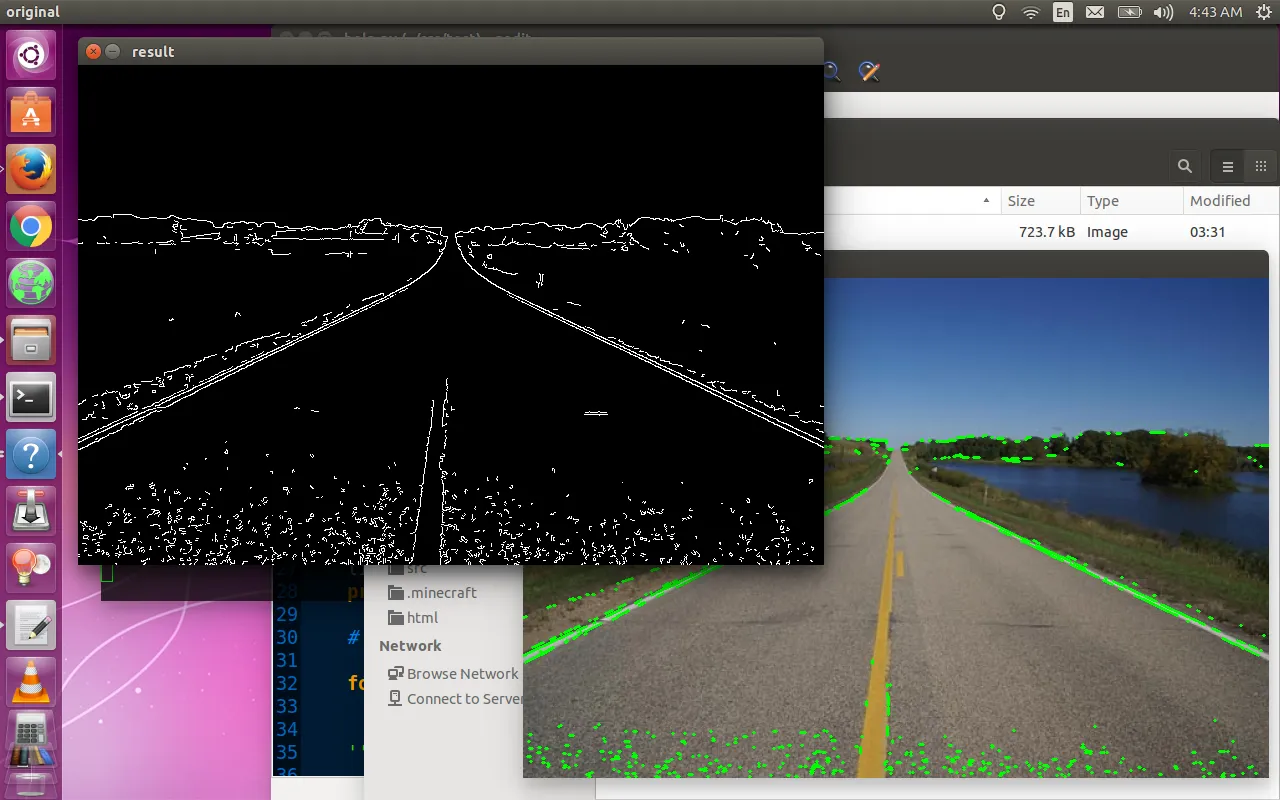
我还尝试了概率霍夫线变换,用于车道检测的绿色线不像另一个方法那样无限延伸,但它无法标记和检测整个车道。
我正在尝试在这里复制结果(通过Python编写)。
http://www.transistor.io/revisiting-lane-detection-using-opencv.html
我该怎么做才能解决这个问题?
代码:
import numpy as np
import cv2
from matplotlib import pyplot as plt
from PIL import Image
import imutils

def invert_img(img):
    img = (255-img)
    return img

def canny(imgray):
    imgray = cv2.GaussianBlur(imgray, (5,5), 200)
    canny_low = 5
    canny_high = 150

    thresh = cv2.Canny(imgray,canny_low,canny_high)
    return thresh

def filtering(imgray):
    thresh = canny(imgray)

    minLineLength = 1
    maxLineGap = 1


    lines = cv2.HoughLines(thresh,1,np.pi/180,0)
    #lines = cv2.HoughLinesP(thresh,2,np.pi/180,100,minLineLength,maxLineGap)
    print lines.shape

    # Code for HoughLinesP
    '''
    for i in range(0,lines.shape[0]):
        for x1,y1,x2,y2 in lines[i]:
            cv2.line(img,(x1,y1),(x2,y2),(0,255,0),2)
    '''

    # Code for HoughLines

    for i in range(0,5):
        for rho,theta in lines[i]:
            a = np.cos(theta)
            b = np.sin(theta)
            x0 = a*rho
            y0 = b*rho
            x1 = int(x0 + 1000*(-b))
            y1 = int(y0 + 1000*(a))
            x2 = int(x0 - 1000*(-b))
            y2 = int(y0 - 1000*(a))

            cv2.line(img,(x1,y1),(x2,y2),(0,0,255),2)


    return thresh


img = cv2.imread('images/road_0.bmp')


imgray = cv2.cvtColor(img, cv2.COLOR_BGR2GRAY)

img = imutils.resize(img, height = 500)
imgray = imutils.resize(imgray, height = 500)

thresh = filtering(imgray)

cv2.imshow('original', img)
cv2.imshow('result', thresh)
cv2.waitKey(0)