k-means聚类中是否可能出现重叠的簇?

3

我不确定为什么k-means聚类中可能存在重叠的聚类。从Chen(2018)的定义中,我看到以下内容:

"..将观测结果作为样本集分为K个不相交的簇"

然而,我在我的图中看到了重叠,并不确定为什么会这样。

作为参考,我正在尝试对一个具有三个变量(Recency,Frequency,Revenue)的多维数据集进行聚类。为了可视化聚类,我可以使用PCA将3D数据投影到2D上,并在其上运行k-means。下面是我获得的代码和图:

df1=tx_user[["Recency","Frequency","Revenue"]]
#standardize
names = df1.columns
# Create the Scaler object
scaler = preprocessing.StandardScaler()
# Fit your data on the scaler object
scaled_df1 = scaler.fit_transform(df1)
df1 = pd.DataFrame(scaled_df1, columns=names)
df1.head()
del scaled_df1

sklearn_pca = PCA(n_components = 2)
X1 = sklearn_pca.fit_transform(df1)
X1 = X1[:, ::-1] # flip axes for better plotting
kmeans = KMeans(3, random_state=0)
labels = kmeans.fit(X1).predict(X1)
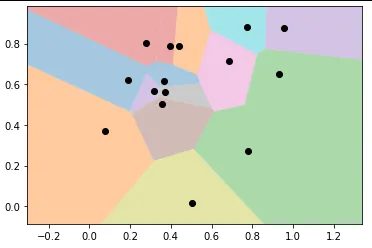
plt.scatter(X1[:, 0], X1[:, 1], c=labels, s=40, cmap='viridis');

from sklearn.cluster import KMeans
from scipy.spatial.distance import cdist

def plot_kmeans(kmeans, X, n_clusters=4, rseed=0, ax=None):
    labels = kmeans.fit_predict(X)

    # plot the input data
    ax = ax or plt.gca()
    ax.axis('equal')
    #ax.set_ylim(-5000,7000)
    ax.scatter(X[:, 0], X[:, 1], c=labels, s=40, cmap='viridis', zorder=2)

    # plot the representation of the KMeans model
    centers = kmeans.cluster_centers_
    radii = [cdist(X[labels == i], [center]).max()
             for i, center in enumerate(centers)]
    for c, r in zip(centers, radii):
        ax.add_patch(plt.Circle(c, r, fc='#CCCCCC', lw=3, alpha=0.5, zorder=1))

kmeans = KMeans(n_clusters=4, random_state=0)
plot_kmeans(kmeans, X1)

K均值聚类图

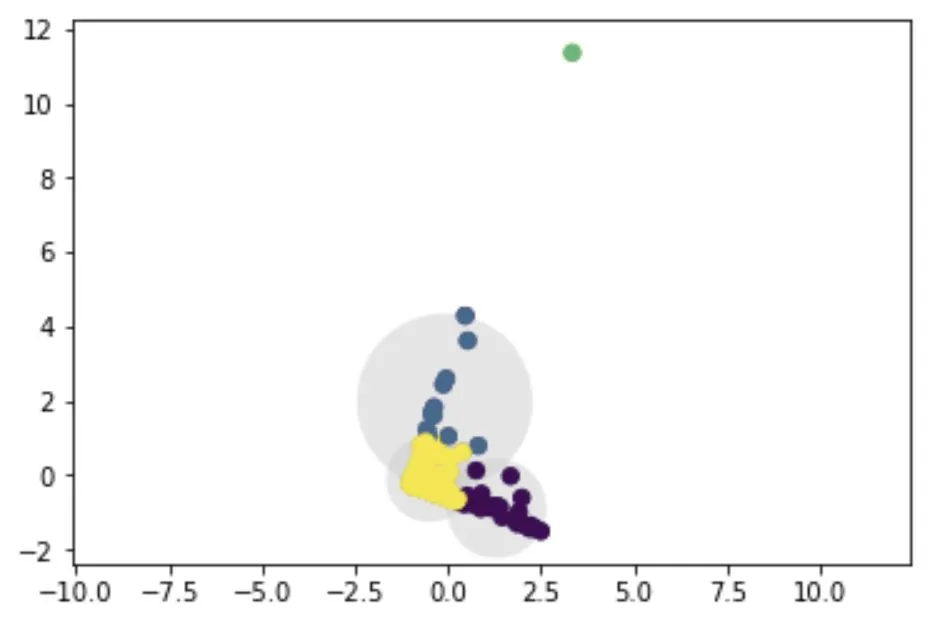
我的问题是: 1. 为什么会存在重叠区域?如果存在重叠区域,我的聚类是否就出现了错误? 2. 如果存在重叠区域,K均值聚类如何决定聚类分配?

谢谢

参考文献: Chen, L., Xu, Z., Wang, H., & Liu, S. (2018). An ordered clustering algorithm based on K-means and the PROMETHEE method. International Journal of Machine Learning and Cybernetics, 9(6), 917-926.


1
按照k-means算法的定义,聚类是不重叠的。 - Nikos M.
我明白了,我会更新问题。你有什么想法为什么我的图表重叠了吗? - Thelonious Monk
2个回答

3

K-means通过平均逼近计算k个聚类。每个聚类由它们的计算中心定义,因此根据定义是唯一的。

样本分配是根据距离聚类中心最近的聚类进行的,也是根据定义唯一的。因此在这个意义上,没有重叠

然而,对于给定的距离d>0,一个样本可能与多个聚类中心的d距离之内(可能), 这就是说当你说“重叠”时所看到的情况。然而,样本仍分配给最近的聚类而不是所有聚类。所以没有重叠。

注意: 如果一个样本到多个聚类中心的距离相同,则可以在最近的聚类之间进行任意随机分配,这对算法或结果没有任何重要影响,因为在分配后聚类会重新计算。


2
Kmeans算法是一种迭代算法,旨在将数据集划分为K个预定义的不重叠子组(簇),每个数据点只属于一个组。它试图使簇间数据点尽可能相似,同时保持簇之间的差异(距离)尽可能大。它将数据点分配到一个簇中,使得数据点与该簇的质心(属于该簇的所有数据点的算术平均值)之间的平方距离和最小。簇内变化越小,同一簇内的数据点越同质(相似)。
也许你做错了什么……我没有你的数据,所以无法进行测试。你可以添加边界,并检查它们。请参见下面的示例代码。
import numpy as np
import matplotlib.pyplot as plt
from scipy.spatial import Voronoi

def voronoi_finite_polygons_2d(vor, radius=None):
    """
    Reconstruct infinite voronoi regions in a 2D diagram to finite
    regions.

    Parameters
    ----------
    vor : Voronoi
        Input diagram
    radius : float, optional
        Distance to 'points at infinity'.

    Returns
    -------
    regions : list of tuples
        Indices of vertices in each revised Voronoi regions.
    vertices : list of tuples
        Coordinates for revised Voronoi vertices. Same as coordinates
        of input vertices, with 'points at infinity' appended to the
        end.

    """

    if vor.points.shape[1] != 2:
        raise ValueError("Requires 2D input")

    new_regions = []
    new_vertices = vor.vertices.tolist()

    center = vor.points.mean(axis=0)
    if radius is None:
        radius = vor.points.ptp().max()*2

    # Construct a map containing all ridges for a given point
    all_ridges = {}
    for (p1, p2), (v1, v2) in zip(vor.ridge_points, vor.ridge_vertices):
        all_ridges.setdefault(p1, []).append((p2, v1, v2))
        all_ridges.setdefault(p2, []).append((p1, v1, v2))

    # Reconstruct infinite regions
    for p1, region in enumerate(vor.point_region):
        vertices = vor.regions[region]

        if all([v >= 0 for v in vertices]):
            # finite region
            new_regions.append(vertices)
            continue

        # reconstruct a non-finite region
        ridges = all_ridges[p1]
        new_region = [v for v in vertices if v >= 0]

        for p2, v1, v2 in ridges:
            if v2 < 0:
                v1, v2 = v2, v1
            if v1 >= 0:
                # finite ridge: already in the region
                continue

            # Compute the missing endpoint of an infinite ridge

            t = vor.points[p2] - vor.points[p1] # tangent
            t /= np.linalg.norm(t)
            n = np.array([-t[1], t[0]])  # normal

            midpoint = vor.points[[p1, p2]].mean(axis=0)
            direction = np.sign(np.dot(midpoint - center, n)) * n
            far_point = vor.vertices[v2] + direction * radius

            new_region.append(len(new_vertices))
            new_vertices.append(far_point.tolist())

        # sort region counterclockwise
        vs = np.asarray([new_vertices[v] for v in new_region])
        c = vs.mean(axis=0)
        angles = np.arctan2(vs[:,1] - c[1], vs[:,0] - c[0])
        new_region = np.array(new_region)[np.argsort(angles)]

        # finish
        new_regions.append(new_region.tolist())

    return new_regions, np.asarray(new_vertices)

# make up data points
np.random.seed(1234)
points = np.random.rand(15, 2)

# compute Voronoi tesselation
vor = Voronoi(points)

# plot
regions, vertices = voronoi_finite_polygons_2d(vor)
print("--")
print(regions)
print("--")
print(vertices)

# colorize
for region in regions:
    polygon = vertices[region]
    plt.fill(*zip(*polygon), alpha=0.4)

plt.plot(points[:,0], points[:,1], 'ko')
plt.axis('equal')
plt.xlim(vor.min_bound[0] - 0.1, vor.max_bound[0] + 0.1)
plt.ylim(vor.min_bound[1] - 0.1, vor.max_bound[1] + 0.1)

在此输入图片描述

这是一个很好的资源。

https://scikit-learn.org/stable/auto_examples/cluster/plot_kmeans_digits.html


在我的可视化中,圆的半径由质心和簇中最远点之间的距离定义。 - Thelonious Monk

网页内容由stack overflow 提供, 点击上面的
可以查看英文原文,
原文链接