网络X中的多层图

10
我想创建一个多层图表(类似于附图),通过连接使用以下代码编写的两个图表,使用networkx
#Graph1
g1 = nx.read_edgelist('sample.txt', nodetype=str)
pos = nx.shell_layout(g)
plt.figure(figsize=(10, 10))
nx.draw_networkx_edges(g, pos, edge_color='khaki', alpha=1)
nx.draw_networkx_nodes(g,pos,node_color='r',alpha=0.5,node_size=1000)
nx.draw_networkx_labels(g, pos, font_size=10,font_family='IPAexGothic')
plt.axis('off')

#Graph2
g2 = nx.read_edgelist('sample2.txt', nodetype=str)
pos = nx.shell_layout(g)
plt.figure(figsize=(10, 10))
nx.draw_networkx_edges(g, pos, edge_color='khaki', alpha=1)
nx.draw_networkx_nodes(g,pos,node_color='r',alpha=0.5,node_size=1000)
nx.draw_networkx_labels(g, pos, font_size=10,font_family='IPAexGothic')
plt.axis('off')

enter image description here

enter image description here

enter image description here


你好,欢迎来到 Stack Overflow。您能更具体地说明您想如何连接这些图形吗?您能提供两个图形及其所需结果的最小示例吗? - Itamar Mushkin
我需要其他的信息吗? - pilomuuuu
2个回答

18

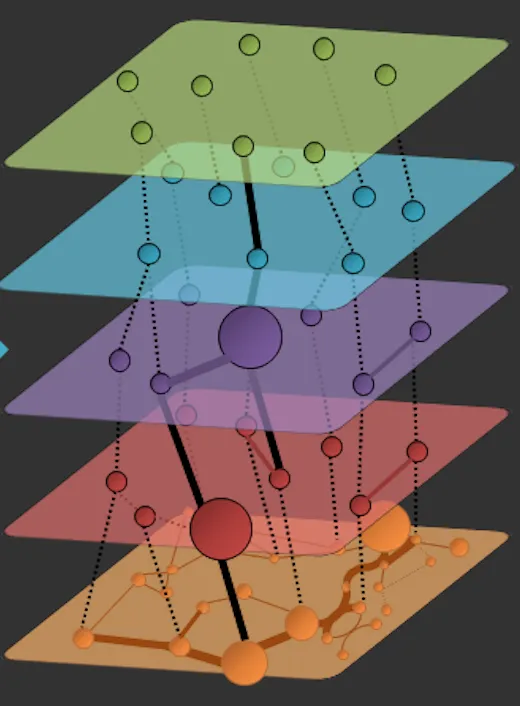
networkx 目前没有内置支持分层布局的功能,更不用说像示例中展示的可视化。因此我们需要自己动手实现。

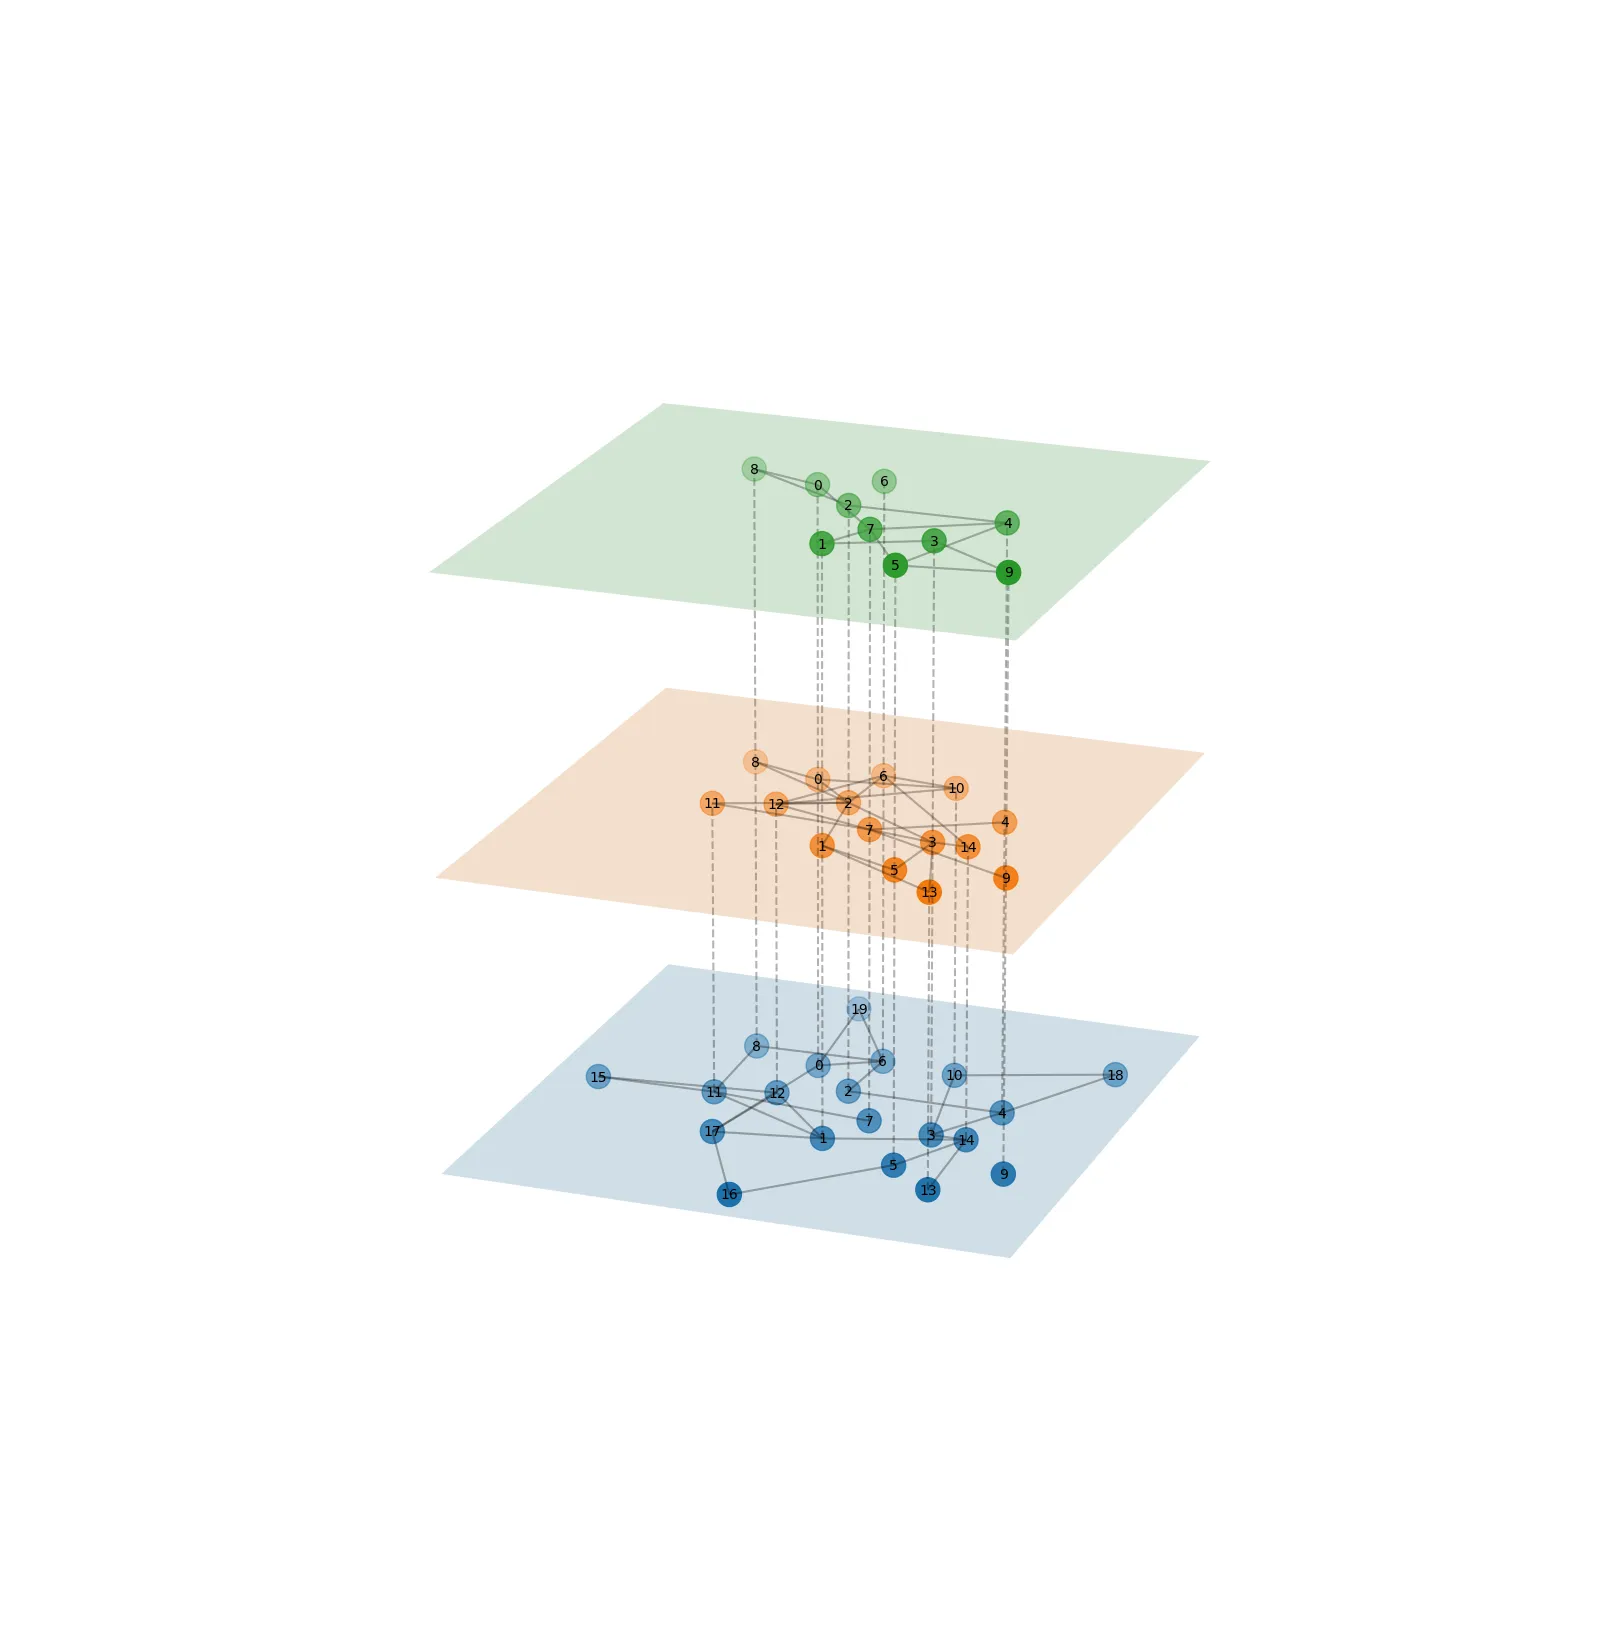
下面的实现 LayeredNetworkGraph 假设你有一个表示不同层的图形列表 [g1, g2, ..., gn]。在一层内,相应的(子)图定义了连接性。在层之间,后续层中的节点如果具有相同的节点ID,则相互连接。

由于没有(据我所知)能够在三维空间中计算具有层内节点平面约束的节点位置的布局函数,因此我们使用一个小技巧:在所有层之间创建图形组合,计算二维位置,然后将这些位置应用于所有层中的节点。可以使用真正的力导向布局来计算带有平面约束的布局,但这将是很多工作,而且由于您的示例仅使用了shell布局(不受影响),因此我没有费心。在许多情况下,差异会很小。

如果您想更改可视化方面的某些内容(如大小、宽度、颜色),请查看 draw 方法。您可能需要进行的大多数更改都可以在那里完成。

多层网络的绘图

#!/usr/bin/env python
"""
Plot multi-graphs in 3D.
"""
import numpy as np
import matplotlib.pyplot as plt
import networkx as nx

from mpl_toolkits.mplot3d import Axes3D
from mpl_toolkits.mplot3d.art3d import Line3DCollection


class LayeredNetworkGraph(object):

    def __init__(self, graphs, node_labels=None, layout=nx.spring_layout, ax=None):
        """Given an ordered list of graphs [g1, g2, ..., gn] that represent
        different layers in a multi-layer network, plot the network in
        3D with the different layers separated along the z-axis.

        Within a layer, the corresponding graph defines the connectivity.
        Between layers, nodes in subsequent layers are connected if
        they have the same node ID.

        Arguments:
        ----------
        graphs : list of networkx.Graph objects
            List of graphs, one for each layer.

        node_labels : dict node ID : str label or None (default None)
            Dictionary mapping nodes to labels.
            If None is provided, nodes are not labelled.

        layout_func : function handle (default networkx.spring_layout)
            Function used to compute the layout.

        ax : mpl_toolkits.mplot3d.Axes3d instance or None (default None)
            The axis to plot to. If None is given, a new figure and a new axis are created.

        """

        # book-keeping
        self.graphs = graphs
        self.total_layers = len(graphs)

        self.node_labels = node_labels
        self.layout = layout

        if ax:
            self.ax = ax
        else:
            fig = plt.figure()
            self.ax = fig.add_subplot(111, projection='3d')

        # create internal representation of nodes and edges
        self.get_nodes()
        self.get_edges_within_layers()
        self.get_edges_between_layers()

        # compute layout and plot
        self.get_node_positions()
        self.draw()


    def get_nodes(self):
        """Construct an internal representation of nodes with the format (node ID, layer)."""
        self.nodes = []
        for z, g in enumerate(self.graphs):
            self.nodes.extend([(node, z) for node in g.nodes()])


    def get_edges_within_layers(self):
        """Remap edges in the individual layers to the internal representations of the node IDs."""
        self.edges_within_layers = []
        for z, g in enumerate(self.graphs):
            self.edges_within_layers.extend([((source, z), (target, z)) for source, target in g.edges()])


    def get_edges_between_layers(self):
        """Determine edges between layers. Nodes in subsequent layers are
        thought to be connected if they have the same ID."""
        self.edges_between_layers = []
        for z1, g in enumerate(self.graphs[:-1]):
            z2 = z1 + 1
            h = self.graphs[z2]
            shared_nodes = set(g.nodes()) & set(h.nodes())
            self.edges_between_layers.extend([((node, z1), (node, z2)) for node in shared_nodes])


    def get_node_positions(self, *args, **kwargs):
        """Get the node positions in the layered layout."""
        # What we would like to do, is apply the layout function to a combined, layered network.
        # However, networkx layout functions are not implemented for the multi-dimensional case.
        # Futhermore, even if there was such a layout function, there probably would be no straightforward way to
        # specify the planarity requirement for nodes within a layer.
        # Therefor, we compute the layout for the full network in 2D, and then apply the
        # positions to the nodes in all planes.
        # For a force-directed layout, this will approximately do the right thing.
        # TODO: implement FR in 3D with layer constraints.

        composition = self.graphs[0]
        for h in self.graphs[1:]:
            composition = nx.compose(composition, h)

        pos = self.layout(composition, *args, **kwargs)

        self.node_positions = dict()
        for z, g in enumerate(self.graphs):
            self.node_positions.update({(node, z) : (*pos[node], z) for node in g.nodes()})


    def draw_nodes(self, nodes, *args, **kwargs):
        x, y, z = zip(*[self.node_positions[node] for node in nodes])
        self.ax.scatter(x, y, z, *args, **kwargs)


    def draw_edges(self, edges, *args, **kwargs):
        segments = [(self.node_positions[source], self.node_positions[target]) for source, target in edges]
        line_collection = Line3DCollection(segments, *args, **kwargs)
        self.ax.add_collection3d(line_collection)


    def get_extent(self, pad=0.1):
        xyz = np.array(list(self.node_positions.values()))
        xmin, ymin, _ = np.min(xyz, axis=0)
        xmax, ymax, _ = np.max(xyz, axis=0)
        dx = xmax - xmin
        dy = ymax - ymin
        return (xmin - pad * dx, xmax + pad * dx), \
            (ymin - pad * dy, ymax + pad * dy)


    def draw_plane(self, z, *args, **kwargs):
        (xmin, xmax), (ymin, ymax) = self.get_extent(pad=0.1)
        u = np.linspace(xmin, xmax, 10)
        v = np.linspace(ymin, ymax, 10)
        U, V = np.meshgrid(u ,v)
        W = z * np.ones_like(U)
        self.ax.plot_surface(U, V, W, *args, **kwargs)


    def draw_node_labels(self, node_labels, *args, **kwargs):
        for node, z in self.nodes:
            if node in node_labels:
                ax.text(*self.node_positions[(node, z)], node_labels[node], *args, **kwargs)


    def draw(self):

        self.draw_edges(self.edges_within_layers,  color='k', alpha=0.3, linestyle='-', zorder=2)
        self.draw_edges(self.edges_between_layers, color='k', alpha=0.3, linestyle='--', zorder=2)

        for z in range(self.total_layers):
            self.draw_plane(z, alpha=0.2, zorder=1)
            self.draw_nodes([node for node in self.nodes if node[1]==z], s=300, zorder=3)

        if self.node_labels:
            self.draw_node_labels(self.node_labels,
                                  horizontalalignment='center',
                                  verticalalignment='center',
                                  zorder=100)


if __name__ == '__main__':

    # define graphs
    n = 5
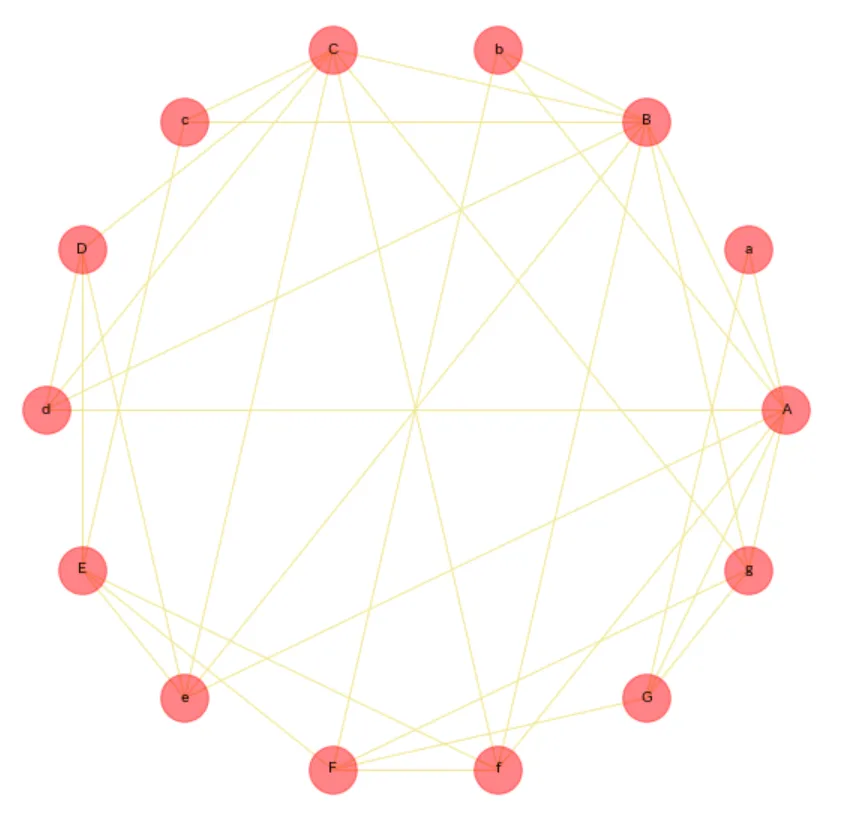
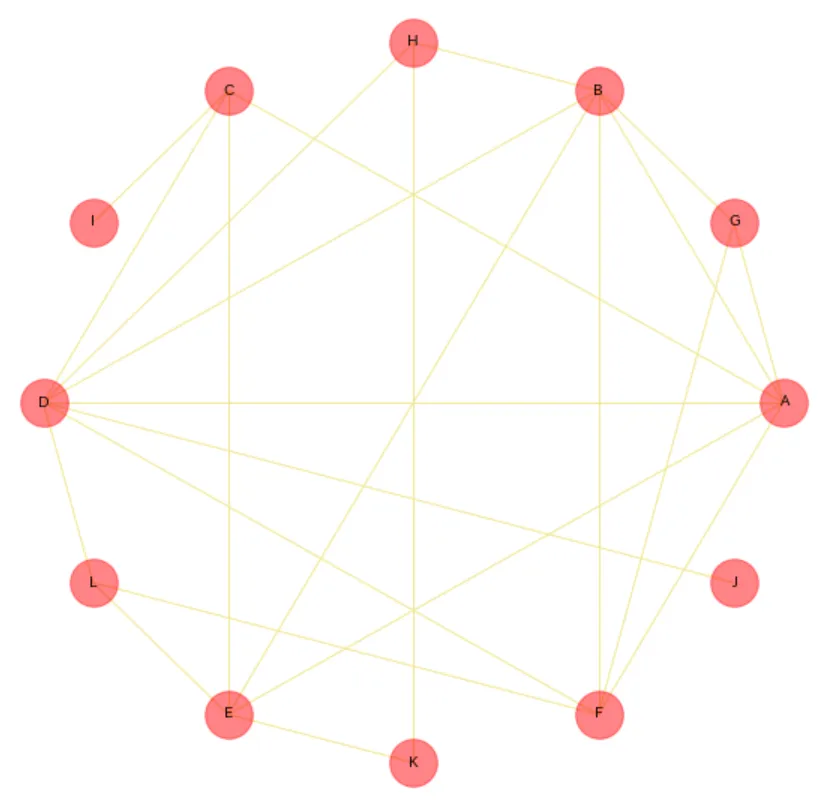
    g = nx.erdos_renyi_graph(4*n, p=0.1)
    h = nx.erdos_renyi_graph(3*n, p=0.2)
    i = nx.erdos_renyi_graph(2*n, p=0.4)

    node_labels = {nn : str(nn) for nn in range(4*n)}

    # initialise figure and plot
    fig = plt.figure()
    ax = fig.add_subplot(111, projection='3d')
    LayeredNetworkGraph([g, h, i], node_labels=node_labels, ax=ax, layout=nx.spring_layout)
    ax.set_axis_off()
    plt.show()

谢谢这个。在尝试多种其他选项来可视化多重网络后,这对我非常有用。一个快速的问题 - 我该如何为每个级别添加标签? - Ylli Prifti
@YlliPrifti 飞机的 z 坐标只是从零开始的自然数。飞机的 x、y 范围取决于所使用的布局函数。Networkx 布局通常会重新缩放到一个边界框,其中 (0,0) 为原点,比例为 (1,1)。因此,我敢打赌 (1.1, 0.5, z) 是很好的标签位置。您可以使用标准的 matplotlib ax.text 命令 添加标签。 - Paul Brodersen

0
上述解决方案在最新的networkx上对我无效。我创建了一个gist,提供了一个扁平化的networkx版本。
import proplot as plt, cmasher as cmr, pandas as pd, numpy as np, os, sys, networkx as nx, warnings


def multilayer_layout(
    G: nx.Graph,
    subset_key="layer",
    layout=nx.spring_layout,
    separation: float = 2.0,
) -> dict:
    # set positions
    layers = {}
    for node, layer in nx.get_node_attributes(G, subset_key).items():
        layers[layer] = layers.get(layer, []) + [node]

    # set layout within each layer
    pos = {}
    for layer, nodes in layers.items():
        subgraph = G.subgraph(nodes)
        layer_pos = {
            node: node_pos + separation * np.array([0, int(layer)])
            for node, node_pos in layout(subgraph).items()
        }
        pos.update(layer_pos)
    return pos


def draw_multilayer_layout(
    G,
    subset_key="layer",
    ax=None,
    layout=nx.spring_layout,
    separation=2.0,
    node_kwargs=dict(node_size=12),
    within_edge_kwargs=dict(style="solid", alpha=0.05),
    between_edge_kwargs=dict(style="dashed", alpha=0.65),
    cmap="Pastel2",
):
    # get the layout
    pos = multilayer_layout(
        G,
        subset_key=subset_key,
        layout=layout,
        separation=separation,
    )

    # find connections between and plot them differently
    connectors = set()
    others = set()
    for node in G.nodes():
        for neighbor in G.neighbors(node):
            if G.nodes[node][subset_key] != G.nodes[neighbor][subset_key]:
                connectors.add((node, neighbor))
            else:
                others.add((node, neighbor))
    # draw the graph
    if ax is None:
        fig, ax = plt.subplots()

    attr = set(nx.get_node_attributes(G, subset_key).values())
    color_space = np.linspace(0, 1, len(attr), 0)
    cmap = cmr.pride(color_space)

    node_colors = [cmap[G.nodes[node]["layer"]] for node in G.nodes()]
    nx.draw_networkx_nodes(G, pos, node_color=node_colors, **node_kwargs)
    nx.draw_networkx_edges(G, pos, edgelist=others, **within_edge_kwargs)
    nx.draw_networkx_edges(G, pos, edgelist=connectors, **between_edge_kwargs)
    return ax


def disjoint_union_all(Gs: list[nx.Graph]) -> nx.Graph:
    G = Gs[0]
    for Gi in Gs[1:]:
        G = nx.disjoint_union(G, Gi)
    return G


if __name__ == "__main__":
    graphs = []
    for layer in range(3):
        g = nx.erdos_renyi_graph(100, 0.2)
        nx.set_node_attributes(g, layer, "layer")
        graphs.append(g)

    g = disjoint_union_all(graphs)
    from random import sample

    for ni in range(100):
        edge = sample(list(g.nodes()), 2)
        if not g.has_edge(*edge):
            g.add_edge(*edge)

    fig, ax = plt.subplots()
    draw_multilayer_layout(g, ax=ax)
    ax.axis("equal")
    ax.grid(False)

    plt.show(block=1)

网页内容由stack overflow 提供, 点击上面的
可以查看英文原文,
原文链接