我正在尝试使用R中的kernlab库(ksvm函数)实现一个新颖性检测器。以下是我正在尝试完成的简单示例:
# Training data
xxTrain <- matrix(rnorm(2000), nrow=1000, ncol=2, byrow=TRUE)
y <- rep(1,1000)
classifier <- ksvm(xxTrain, y, type="one-svc", kernel="rbfdot", kpar="automatic")
# Test data
x1 <- rnorm(1000)
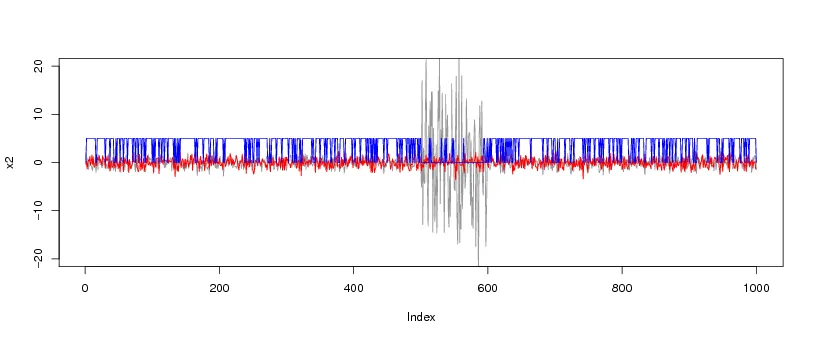
scale <- c(rep(1,500), rep(10,100), rep(1,400))
x2 <- rnorm(1000)*scale
xxTest <- matrix(c(x1,x2), nrow=1000, ncol=2, byrow=TRUE)
# Prediction
p <- predict(classifier, xxTest, type="response")
# Visualization
plot(x2, type='l')
lines(x1, col="red")
points(5*as.integer(p), type='l', col="blue")
上图是我得到的结果。蓝色曲线是预测值,它清晰地显示了一个持续为0的周期。但它与黑色曲线中的异常值在时间和宽度上并不匹配。有100个数据点(黑色曲线)的幅度更大,而我得到的蓝曲线输出与黑线不匹配。
我做错了什么?