使用chart.js创建垂直堆叠条形图

17

优秀免费的库,来自chart.js。我正在将我的图表从Google Charts转移到Chart.js,因为它们可以离线使用,并且对窗口大小变化更敏感。此外,我意识到我的中国观众无法看到我的Google图表,因为在中国封锁了Google服务。

我一直在阅读堆栈式垂直条形图的文档,但我无法弄清楚如何制作这样的图表。在我看到的所有堆栈式条形图示例中,每个条形的项目数量都相同。

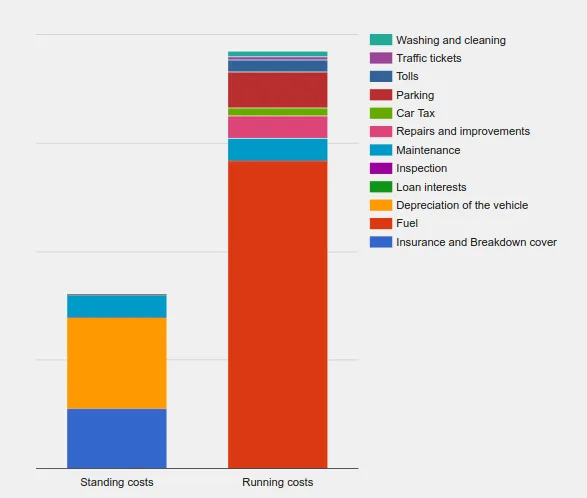
我能否只创建两个垂直堆叠数据集?这是因为右侧的条形比左侧的条形有更多的项目。或者我需要 n 个数据集,其中 n 是具有更多项目的条形的项数吗?

enter image description here

代码

我想将一个数据集分组成(堆叠的)条形图,但我无法做到。

var ctx = document.getElementById("barChart").getContext('2d');
    
var labels = ["standing costs", "running costs"];
var dataset = [ 
                {
                  type: 'bar',
                  label: ["cost1", "cost2", "cost3", "cost4"],
                  data: [1, 2, 1, 3],                       
                  stack: "standing costs",
                  backgroundColor: [
                      'navy',
                      'blue',
                      'aqua',
                      'teal'
                  ]
                },
                {
                  type: 'bar',
                  label: ["cost5", "cost6", "cost7", "cost8"],
                  data: [5, 1, 3, 0],                       
                  stack: "running costs",
                  backgroundColor: [                         
                      'green',
                      'lime',
                      'yellow',
                      'white'
                  ]
                }
            ];

var options = {
    scales: {
      xAxes: [{
        stacked: true
      }],
      yAxes: [{
        stacked: true
      }]
    }
};

var content = {
    type: 'bar',
    data: {
        labels: labels,
        datasets: dataset
    },
    options
};

new Chart(ctx, content);
@import url("https://cdnjs.cloudflare.com/ajax/libs/colors/1.0/colors.min.css");
<script src="https://cdnjs.cloudflare.com/ajax/libs/Chart.js/2.1.0/Chart.bundle.min.js"></script>
<canvas id="barChart"></canvas>

2个回答

40

快速解决方案:

垂直堆叠条形图

var chart = new Chart(ctx, {
   type: 'bar',
   data: {
      labels: ['Standing costs', 'Running costs'], // responsible for how many bars are gonna show on the chart
      // create 12 datasets, since we have 12 items
      // data[0] = labels[0] (data for first bar - 'Standing costs') | data[1] = labels[1] (data for second bar - 'Running costs')
      // put 0, if there is no data for the particular bar
      datasets: [{
         label: 'Washing and cleaning',
         data: [0, 8],
         backgroundColor: '#22aa99'
      }, {
         label: 'Traffic tickets',
         data: [0, 2],
         backgroundColor: '#994499'
      }, {
         label: 'Tolls',
         data: [0, 1],
         backgroundColor: '#316395'
      }, {
         label: 'Parking',
         data: [5, 2],
         backgroundColor: '#b82e2e'
      }, {
         label: 'Car tax',
         data: [0, 1],
         backgroundColor: '#66aa00'
      }, {
         label: 'Repairs and improvements',
         data: [0, 2],
         backgroundColor: '#dd4477'
      }, {
         label: 'Maintenance',
         data: [6, 1],
         backgroundColor: '#0099c6'
      }, {
         label: 'Inspection',
         data: [0, 2],
         backgroundColor: '#990099'
      }, {
         label: 'Loan interest',
         data: [0, 3],
         backgroundColor: '#109618'
      }, {
         label: 'Depreciation of the vehicle',
         data: [0, 2],
         backgroundColor: '#109618'
      }, {
         label: 'Fuel',
         data: [0, 1],
         backgroundColor: '#dc3912'
      }, {
         label: 'Insurance and Breakdown cover',
         data: [4, 0],
         backgroundColor: '#3366cc'
      }]
   },
   options: {
      responsive: false,
      legend: {
         position: 'right' // place legend on the right side of chart
      },
      scales: {
         xAxes: [{
            stacked: true // this should be set to make the bars stacked
         }],
         yAxes: [{
            stacked: true // this also..
         }]
      }
   }
});
<script src="https://cdnjs.cloudflare.com/ajax/libs/Chart.js/2.6.0/Chart.min.js"></script>
<canvas id="ctx" width="700"></canvas>

抱歉没有提供解释。


非常感谢。但请重新查看我的原始帖子。有没有一种方法可以为每个堆叠的条形图分组数据集?我认为有一个数据集属性stack,但我不知道如何使用它。 - João Pimentel Ferreira
1
该属性用于分组堆叠条形图,类似于此处。但从您的问题来看,似乎您并不想要类似于那样的东西,是吗?此外,它存在一些缺陷,因为它没有得到ChartJS的适当支持。 - ɢʀᴜɴᴛ
1
你说得对,不,就像你在这里描述的一样。非常感谢。我会使用你的代码。无论如何,我的建议可能是下一个版本改进的问题。你觉得呢?我应该在Github上开一个问题吗,还是没必要? - João Pimentel Ferreira
1
我认为这是不必要的,因为这不是ChartJS的工作方式。但如果您愿意,可以提交并查看他们的回复。 - ɢʀᴜɴᴛ
1
为了正确显示图表,否则它会被缩小(不总是这样)。 - ɢʀᴜɴᴛ
显示剩余4条评论

-1

已更新至v3版本

<div style="height: 500px">
<canvas id="chart_1" ></canvas>
</div>
<script>

chart = new Chart(document.getElementById('chart_1').getContext('2d'), {
    type: 'bar',
    data: {
        labels: ["One", "Two", "Three"],
        datasets: [{
                label: 'Blue',
                data: [100, 110, 120],
                backgroundColor: 'blue',
            },
            {
                label: 'Red',
                data: [30, 20, 10],
                backgroundColor: 'red',
            },
        ]
    },
    options: {
        plugins: {
            title: {
                display: true,
                text: 'Example',
                font: {
                    size: 14
                }
            },
        },
        responsive: true,
        maintainAspectRatio: false,
        scales: {
            x: {
                stacked: true,
            },
            y: {
                stacked: true
            }
        }
    }
});
</script>

网页内容由stack overflow 提供, 点击上面的
可以查看英文原文,
原文链接