当使用`secondary_y`时,如何更改`pd.DataFrame.plot()`的图例字体大小?

3

问题

  • 我在使用pd.DataFrame.plot()时使用了secondary_y参数。
  • 当我尝试通过.legend(fontsize=20)更改图例的字体大小时,实际上有两列要在图例中打印,但最终只有一列被打印出来。
  • 当我没有使用secondary_y参数时,这个问题(只有一个列名在图例中)并不存在。
  • 我希望我的数据框中的所有列名都能够在图例中打印出来,并且即使在绘制数据框时使用了secondary_y,也能够更改图例的字体大小。

示例

  • 以下示例使用secondary_y参数仅显示一个列名A,而实际上有两个列名A和B。
  • 图例的字体大小已更改,但仅适用于一个列名。
import pandas as pd
import numpy as np

np.random.seed(42)
df = pd.DataFrame(np.random.randn(24*3, 2),
                  index=pd.date_range('1/1/2019', periods=24*3, freq='h'))
df.columns = ['A', 'B']
df.plot(secondary_y = ["B"], figsize=(12,5)).legend(fontsize=20, loc="upper right")

enter image description here

  • 如果我不使用secondary_y,那么图例会显示两列AB
import pandas as pd
import numpy as np

np.random.seed(42)
df = pd.DataFrame(np.random.randn(24*3, 2),
                  index=pd.date_range('1/1/2019', periods=24*3, freq='h'))
df.columns = ['A', 'B']
df.plot(figsize=(12,5)).legend(fontsize=20, loc="upper right")

enter image description here

3个回答

4
这是一个有点晚的回应,但对我有效的方法是在绘图函数之后简单地设置plt.legend(fontsize = wanted_fontsize)

1
为了自定义它,您需要使用Matplotlib的子图功能创建您的图形:
import pandas as pd
import numpy as np
import matplotlib.pyplot as plt 

np.random.seed(42)
df = pd.DataFrame(np.random.randn(24*3, 2),
                  index=pd.date_range('1/1/2019', periods=24*3, freq='h'))
df.columns = ['A', 'B']

#define colors to use
col1 = 'steelblue'
col2 = 'red'

#define subplots
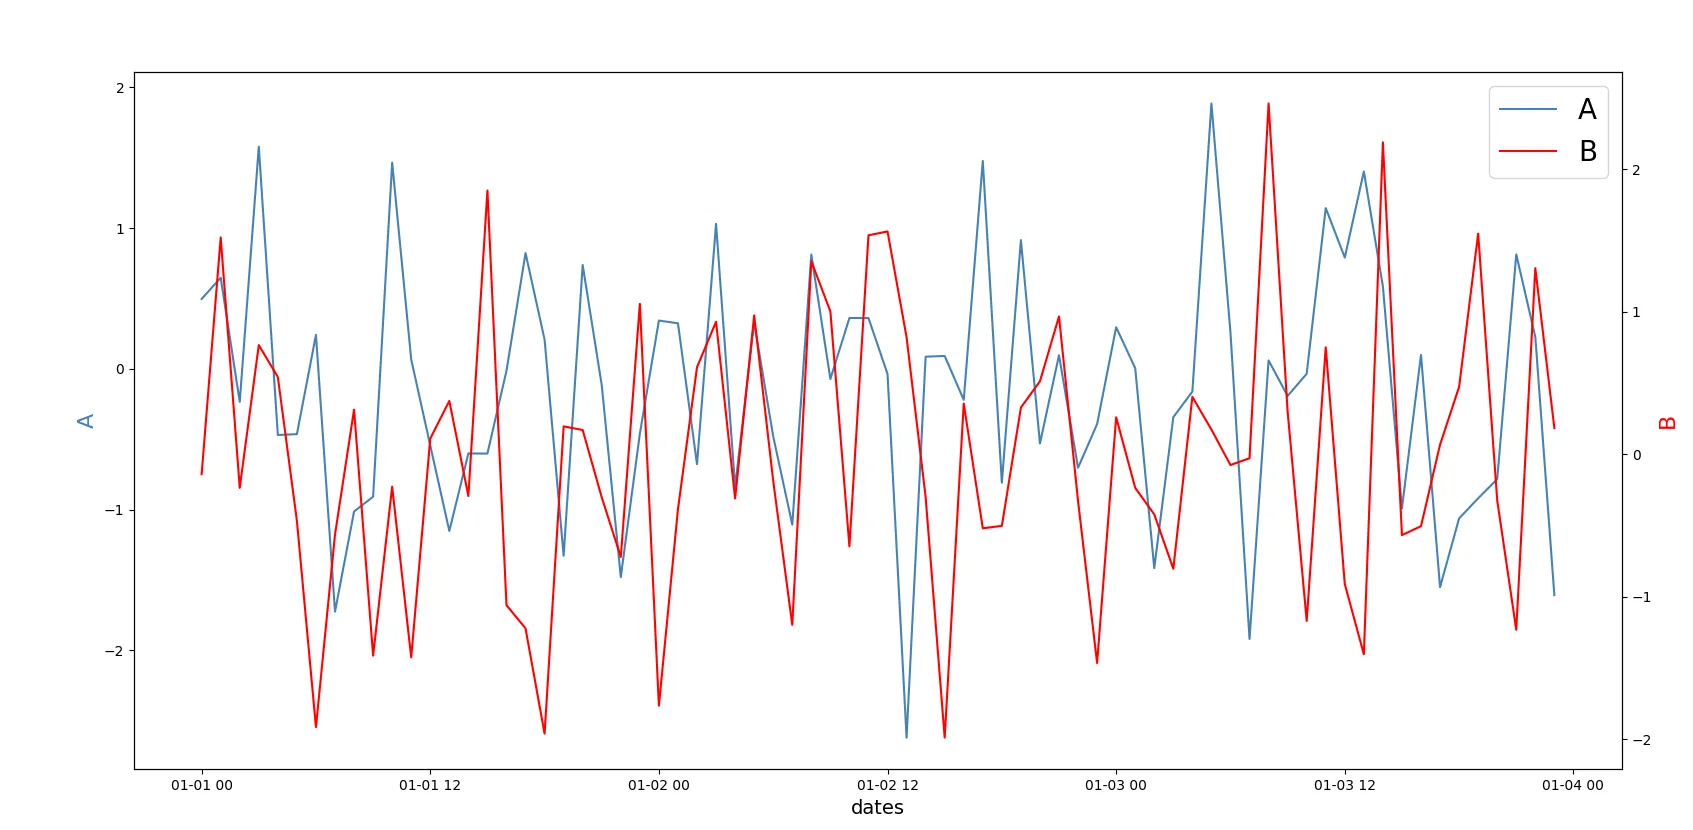
fig,ax = plt.subplots()

#add first line to plot
lns1=ax.plot(df.index,df['A'],  color=col1)

#add x-axis label
ax.set_xlabel('dates', fontsize=14)

#add y-axis label
ax.set_ylabel('A', color=col1, fontsize=16)

#define second y-axis that shares x-axis with current plot
ax2 = ax.twinx()

#add second line to plot
lns2=ax2.plot(df.index,df['B'], color=col2)

#add second y-axis label
ax2.set_ylabel('B', color=col2, fontsize=16)

#legend
ax.legend(lns1+lns2,['A','B'],loc="upper right",fontsize=20)

#another solution is to create legend for fig,:
#fig.legend(['A','B'],loc="upper right")

plt.show()

结果:

这里输入图片描述

有没有更简单的方法来改变图例的字体大小呢?定义两个轴比我技术上能承受的要多。:(我不介意使用另一个库(例如seaborn)。我在绘图时使用数据框是因为
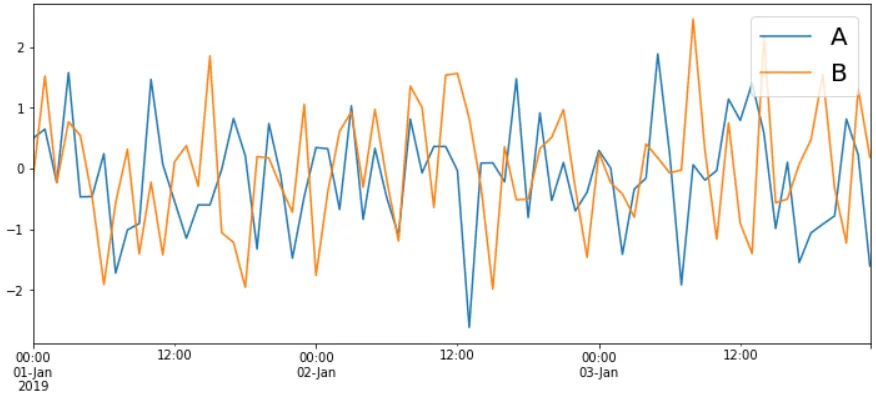
pd.DataFrame.plot()足够简单,适合我使用。 - Eiffelbear

0
我设法解决了这个问题,但我的图例分为两部分:
fig, ax = plt.subplots()

# your code with your plots

ax.legend(['A'], fontsize=15)
ax.right_ax.legend(['B'], fontsize=15)

网页内容由stack overflow 提供, 点击上面的
可以查看英文原文,
原文链接