我需要绘制一个带有断裂X轴的图表(例如下面的图表),使用现有数据,我的问题是是否可以使用seaborn API来实现?
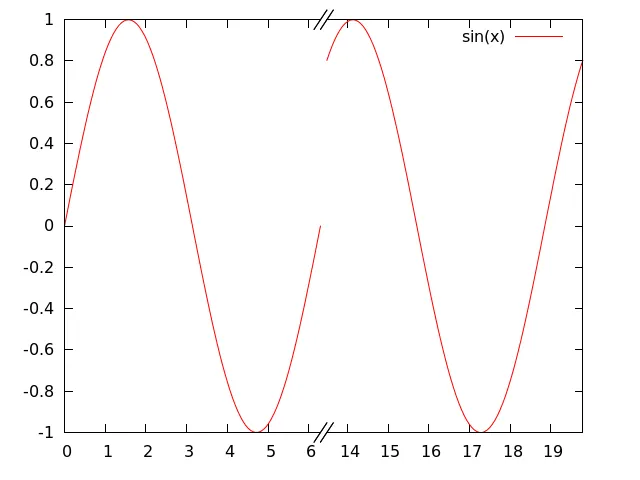
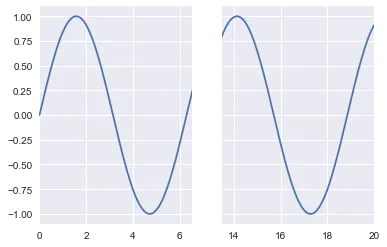
虽然不太漂亮,但是可以使用。
%matplotlib inline  # If you are running this in a Jupyter Notebook.
import seaborn as sns
import numpy as np
import matplotlib.pyplot as plt


x = np.linspace(0, 20, 500)
y = np.sin(x)

f, (ax1, ax2) = plt.subplots(ncols=2, nrows=1, sharey=True)
ax = sns.tsplot(time=x, data=y, ax=ax1)
ax = sns.tsplot(time=x, data=y, ax=ax2)

ax1.set_xlim(0, 6.5)
ax2.set_xlim(13.5, 20)
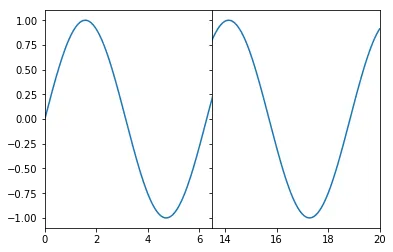
tsplot)。可以通过plt.subplots_adjust(wspace=0, hspace=0)行中的wspace参数来控制图之间的距离。保留HTML标签。
%matplotlib inline
import seaborn as sns
import numpy as np
import matplotlib.pyplot as plt


x = np.linspace(0, 20, 500)
y = np.sin(x)

f, (ax1, ax2) = plt.subplots(ncols=2, nrows=1, sharey=True)
ax = sns.lineplot(x=x, y=y, ax=ax1)
ax = sns.lineplot(x=x, y=y, ax=ax2)

ax1.set_xlim(0, 6.5)
ax2.set_xlim(13.5, 20)

plt.subplots_adjust(wspace=0, hspace=0)
f,(ax,ax2)= plt.subplots(2,1,sharex = True)- TPWang