请看以下示例数据:
x <- rnorm(10000)
y <- rnorm(10000) * x
z <- rnorm(10000) * y
df <- data.frame(x,y,z)
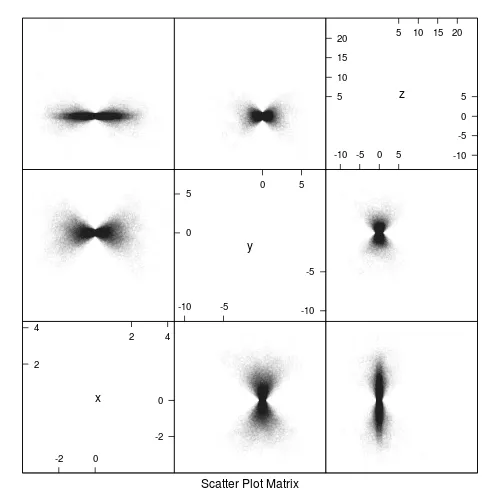
我们可以按照以下方法生成散点图矩阵:
splom(df)
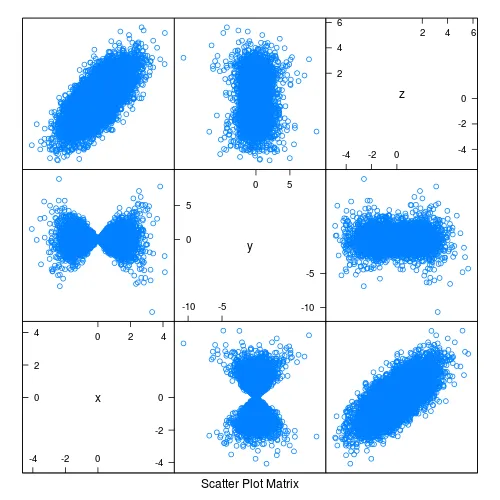
但由于重叠点较多,很难评估密度。
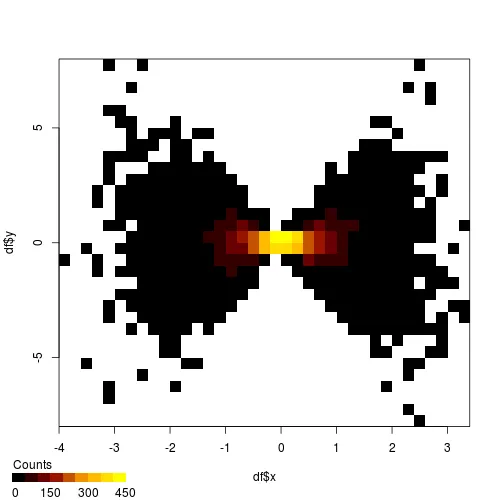
是否有一种简单的方法可以将每个绘图替换为双变量直方图热图,类似于 squash 生成的热图?
library(squash)
hist2(df$x, df$y)
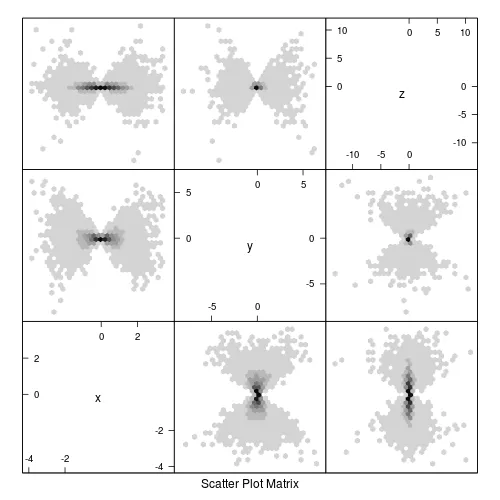
panel.hexbinplot适用于大型数据集,非常方便。
library(hexbin)
splom(df, panel=panel.hexbinplot)
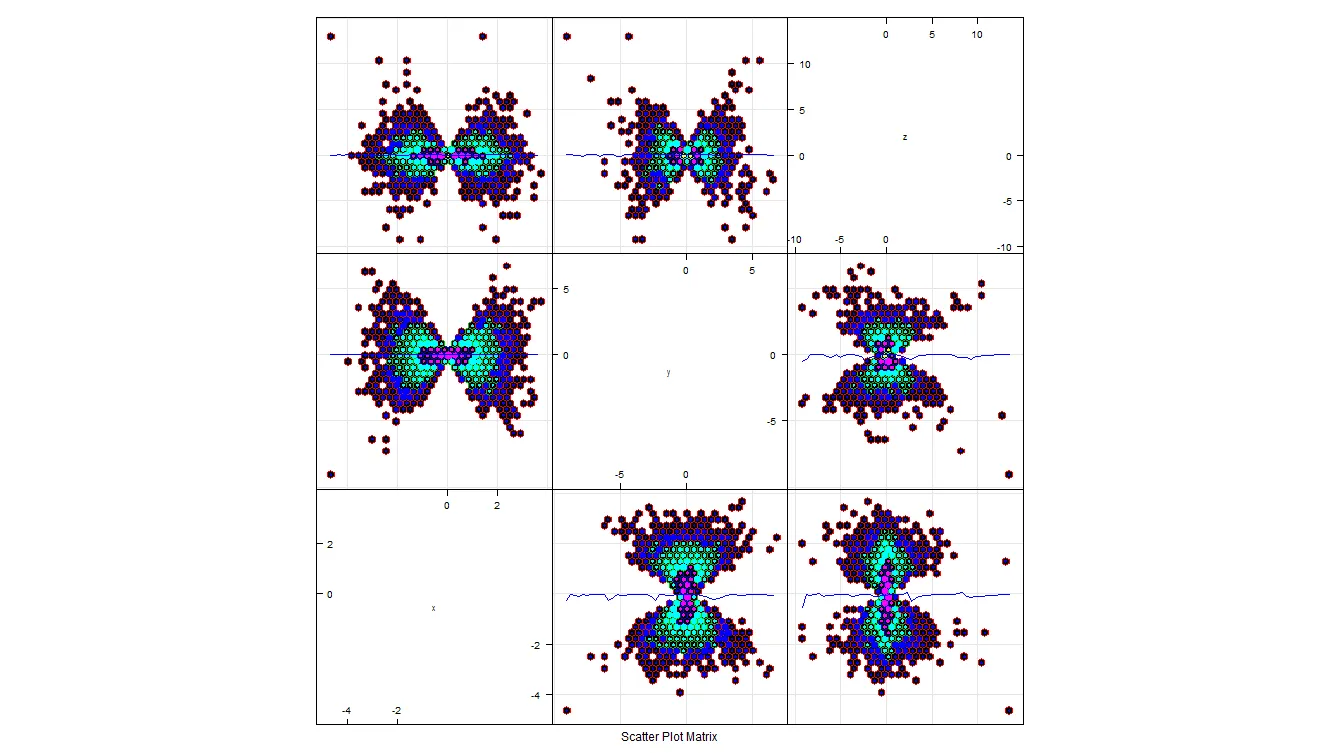
library(hexbin)
splom(df,
      panel = function(x, y, ...){
        panel.hexbinplot(x, y, style = "nested.lattice",
                      type = c("g", "smooth"),col='blue', ...)
      },
      pscale=0, varname.cex=0.7)
您可以操作 style 参数。
# run the code you've provided
library(lattice)
x <- rnorm(10000)
y <- rnorm(10000) * x
z <- rnorm(10000) * y
df <- data.frame(x,y,z)

# look at each of these options one-by-one..  go slowly!

# here's your original
splom(df)


# here each point has been set to very transparent
splom(df , col="#00000005" )
# here each point has been set to moderately transparent
splom(df , col="#00000025" )
# here each point has been set to less transparent
splom(df , col="#00000050" )

splom(df, col="#00000040", pch='.')。 - Andy W这不是你要求的方法,但可以帮助你解决所描述的根本问题 :)
# run the code you've provided
library(lattice)
x <- rnorm(10000)
y <- rnorm(10000) * x
z <- rnorm(10000) * y
df <- data.frame(x,y,z)
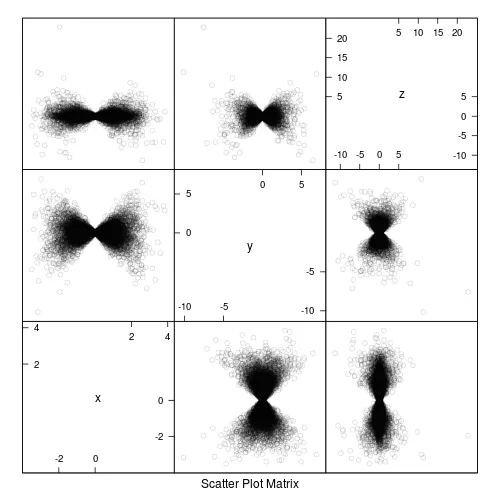
# figure out what ten percent of the total records are
ten.percent <- nrow( df ) / 10
# create a new data frame `df2` containing
# a randomly-sampled ten percent of the original data frame
df2 <- df[ sample( nrow( df ) , ten.percent ) , ]
# now `splom` that.. and notice it's easier to see densities
splom(df2)