单色键对于光栅图和点图的 Levelplot R

4
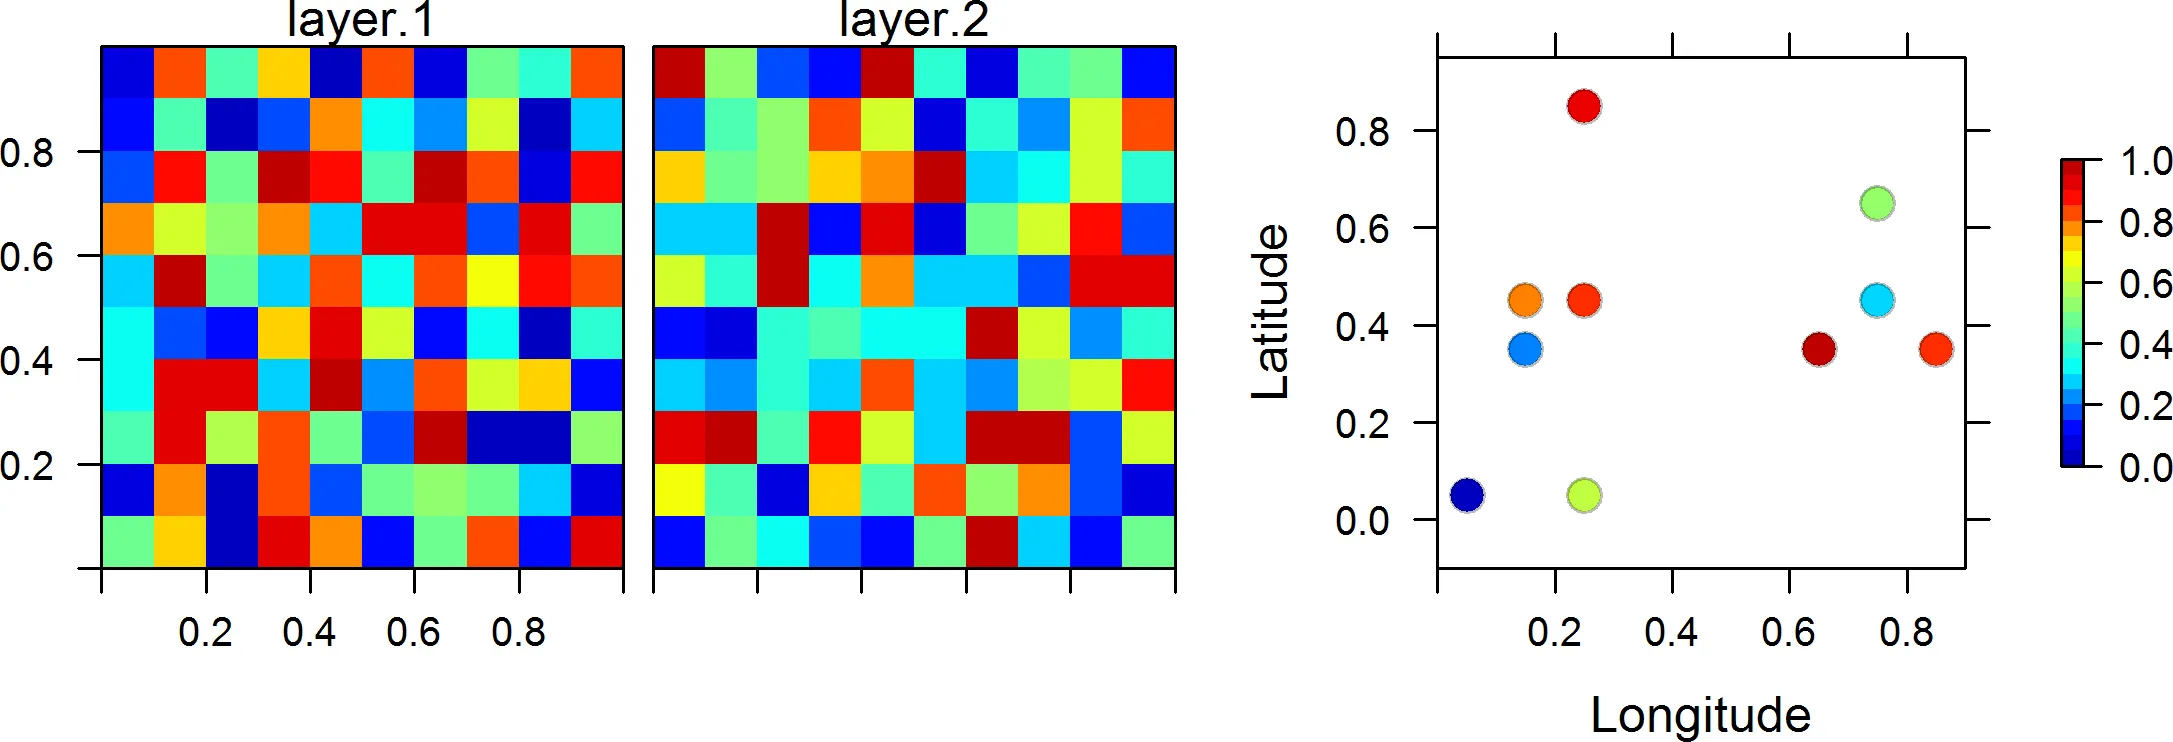
使用下面的示例数据,我如何生成具有与下面手动连接图中相同颜色键的栅格和空间点图?
library(rasterVis)
library(raster)
library(colorRamps)
col=colorRampPalette(matlab.like2(255))

s <- stack(replicate(2, raster(matrix(runif(100), 10))))
xy <- data.frame(coordinates(sampleRandom(s, 10, sp=TRUE)),
                 z1=runif(10), z2=runif(10))

levelplot(s, margin=FALSE, at=seq(0, 1, 0.05),col.regions=col)
x=xy$x;y=xy$y;z=xy$z1

levelplot(z ~ x + y,contour=F, panel = panel.levelplot.points, 
          margin=FALSE,col.regions=col,
          par.settings=list(axis.line=list(lwd=3), strip.border=list(lwd=3)),
         cex=1.4, scales=list(x=list(cex=1.7),y=list(cex=1.7)),xlab=list(label="Longitude",cex=2),
          ylab=list(label="Latitude",cex=2))

样例图

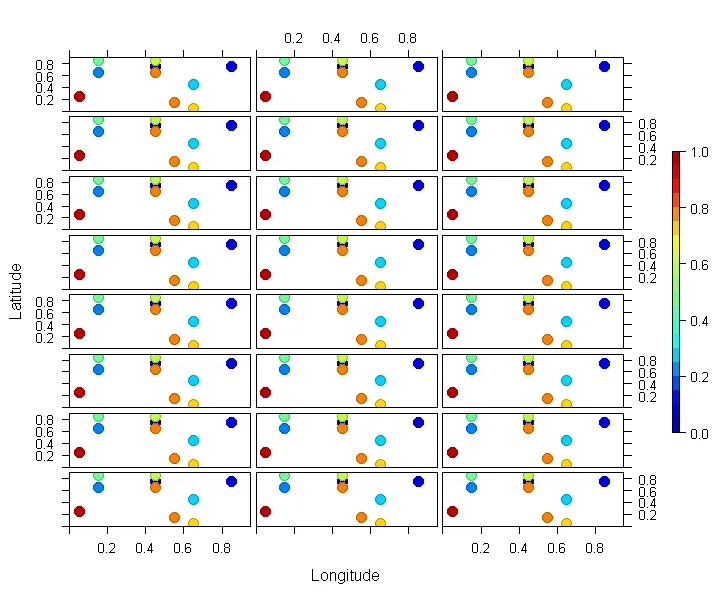
感谢@fdestch的帮助,我使用以下方法生成了上述示意图:

latticeCombineGrid(mget(rep("pp", 24)), layout = c(3, 8))

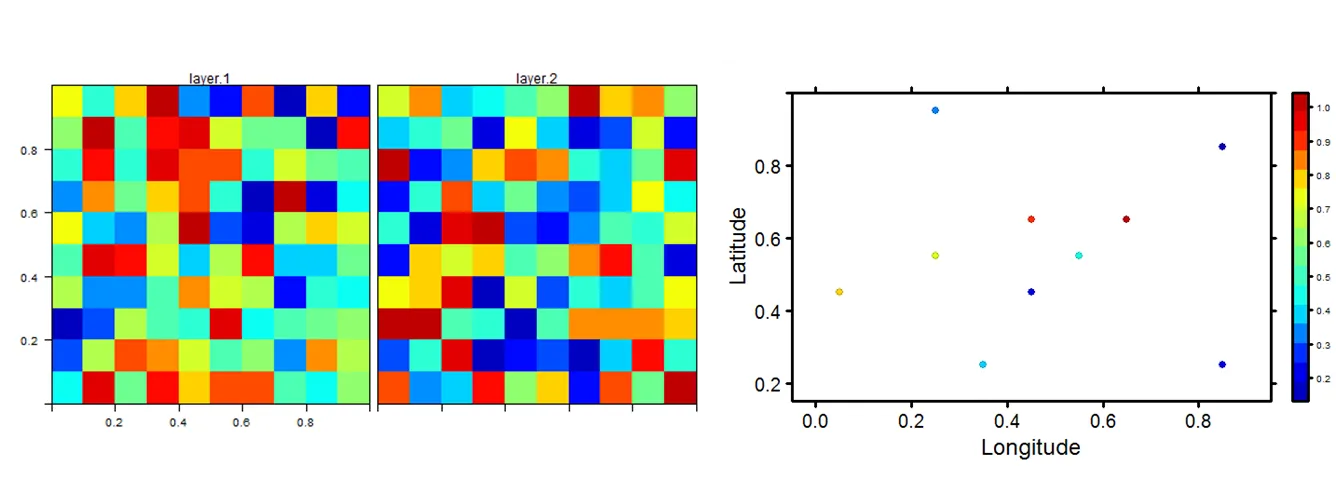
关于使用相同的色标打印多个图形的评论之后,接下来需要澄清的问题:

1) 如何确定面板的顺序?也就是说,像levelplot中使用index.cond一样决定放置特定绘图的行和列。

enter image description here


请针对上一个问题发布不同的提问。 - Oscar Perpiñán
2个回答

4

首先,您应该确保点图中的断点与第一个 levelplot 中定义的断点相同。

## raster plot with colorkey disabled
pr <- levelplot(s, margin = FALSE, at = seq(0, 1, 0.05), col.regions = col, 
                colorkey = FALSE, xlab = list("Longitude", col = "transparent"))

## points plot 
pp <- levelplot(z ~ x + y, panel = panel.levelplot.points, cex = 1.4, 
                contour = FALSE, margin = FALSE, col.regions = col, 
                colorkey = list(at = seq(0, 1, .05), width = .6, height = .6),
                xlab = "Longitude", ylab = "Latitude")

请注意,在创建光栅图时,透明的xlab的定义。当使用downViewport稍后确保实际绘图边界prpp重叠时,这个小技巧非常有用(可以在print(pr, newpage = FALSE)之后立即运行grid.rect()查看我所说的)。然后可以使用grid软件包中的视口轻松实现实际绘图布局。
library(grid)
library(lattice)

## initialize new grid device
grid.newpage()

## add raster plot
vp1 <- viewport(x = 0, y = 0, width = .5, height = 1, 
                just = c("left", "bottom"))

pushViewport(vp1)
print(pr, newpage = FALSE)

## add points plot
downViewport(trellis.vpname("page"))

vp2 <- viewport(x = 1, y = 0, width = .75, height = 1, 
                just = c("left", "bottom"))
pushViewport(vp2)
print(pp, newpage = FALSE)

arranged_plots


非常好的解决方案。非常感谢。如果我有8行和3列要用单个colorkey显示呢?通常我会使用layout=c(3, 8),index.cond=list(c( 1,2,....))来获得我的网格。 Viewport对于排列绘图可能会很棘手。有没有针对layoutindex.cond的任何解决方法? - code123
针对此特定目的,我们的 Rsenal 包中有一个名为 latticeCombineGrid 的函数。只需通过 devtools::install_github("environmentalinformatics-marburg/Rsenal") 安装该包,然后运行例如 latticeCombineGrid(mget(rep("pp", 24)), layout = c(3, 8)) 即可。注意,当所有图形具有相同的 x 和 y 轴限制时,结果看起来最好。 - fdetsch
你救了我的一天。latticeCombineGrid 看起来非常有前途。我一定会试试它。再次感谢。 - code123
为了以后的参考,latticeCombineGrid()已经被移动到Orcs - fdetsch
在上面的图中,如何将x和y刻度标签打印为地理坐标(例如101W,102W,15N等)? - raghav
光栅对象需要分配有效的CRS以正确渲染地理坐标。类似于 projection(s) = "+init=epsg:4326" 的东西应该可以解决问题。对于点数据,基本上也适用,但所涉及的编码会变得更加广泛。我建议您查看 spplot()sfplot() 方法来解决这个问题。 - fdetsch

1

这是我使用 latticeExtra::c.trellis 的解决方案:

library(raster)
library(rasterVis)

s <- stack(replicate(2, raster(matrix(runif(100), 10))))
xy <- data.frame(coordinates(sampleRandom(s, 10, sp=TRUE)),
                 z1=runif(10), z2=runif(10))

## Define theme and breaks
myTheme <- BTCTheme()
my.at <- seq(0, 1, 0.05)
  • Plot the Raster* object, using rasterVis::levelplot:

    p1 <- levelplot(s, margin=FALSE,
                        at = my.at,
                        par.settings = myTheme)
    
  • Plot the points, using lattice::levelplot:

    p2 <- levelplot(z1 ~ x + y, data = xy,
                        at = my.at, 
                        panel = panel.levelplot.points,
                        par.settings = myTheme)
    
  • Join them with latticeExtra::c.trellis:

    p3 <- c(p1, p2, layout = c(3, 1))
    
  • Unfortunately, c.trellis does not assign the strip labels correctly, so you have to define them directly:

    update(p3,
        strip = strip.custom(factor.levels = c(names(s), "Points")))
    

raster + points


这甚至更加直接和容易实现。谢谢。最后一行代码可以用来决定每个图在面板中的位置。如果我知道s的名称,那么我可以轻松地决定它们的显示顺序。 - code123

网页内容由stack overflow 提供, 点击上面的
可以查看英文原文,
原文链接