R绘制的光栅图颜色方案不完全覆盖全范围。

4

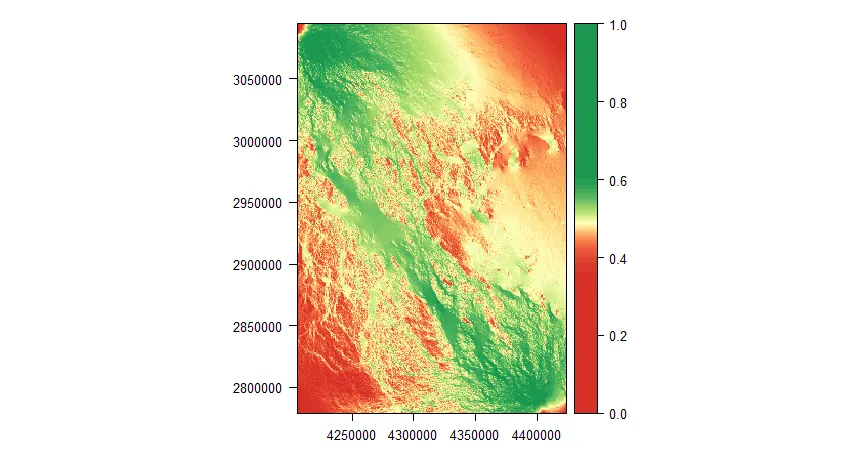
我正在尝试绘制一张栅格图,使用了 Rcolorbrewer 包中定义的颜色方案,目前还没有问题。该栅格图的值范围为 0 到 1,没有缺失值。

library(RColorBrewer)
library(classInt)

pal <- brewer.pal(n=50, name = "RdYlGn")
plot(rw_start_goal_stan, col=pal)

enter image description here

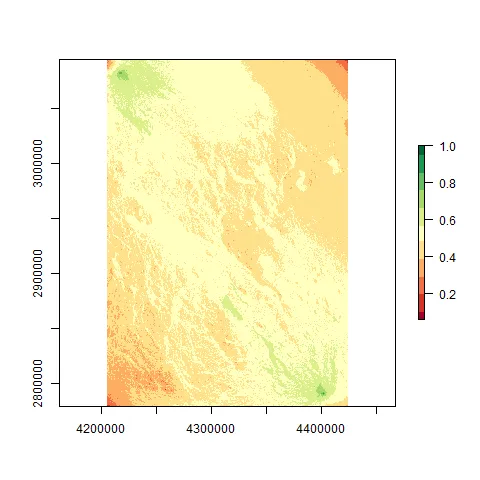
现在我尝试使用ClassInt包计算分位数断点来进行数据分类。

library(RColorBrewer)
library(classInt)

pal <- brewer.pal(n=50, name = "RdYlGn")
breaks.qt <- classIntervals(rw_start_goal_stan@data@values, style = "quantile")
plot(rw_start_goal_stan, breaks = breaks.qt$brks, col=pal)

错误的是,plot() 函数只将颜色方案应用于值范围的50%,其余部分保持为白色。
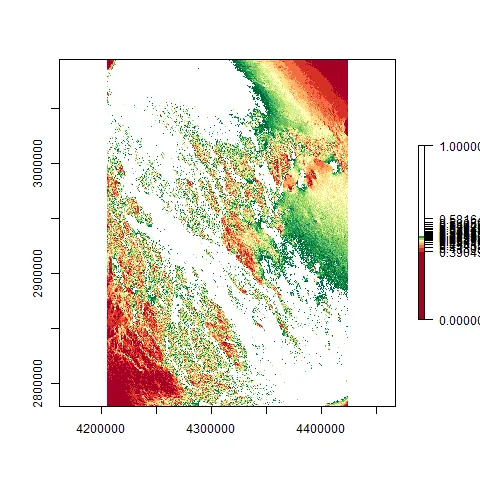
enter image description here

我做错了什么?

1个回答

1

编辑: 使用 OP 提供的数据和 rasterVis::levelplot 解决方案,来源于这个答案

library(raster)
library(rasterVis)
library(classInt)

plotVar <- raster("LCPs_standartized.tif")

nColor <- 50
break1 <- classIntervals(plotVar[!is.na(plotVar)], 
                         n = nColor, style = "quantile")

lvp <- levelplot(plotVar, 
                 col.regions = colorRampPalette(brewer.pal(9, 'RdYlGn')), 
                 at = break1$brks, margin = FALSE)
lvp 

enter image description here


您需要在 classIntervals 中指定颜色数量,然后为该 classInterval 对象分配颜色代码。

library(RColorBrewer)
library(classInt)

plotVar <- rw_start_goal_stan@data@values
nColor <- 50
plotColor <- brewer.pal(nColor, name = "RdYlGn")

# equal-frequency class intervals
class <- classIntervals(plotVar, nColor, style = "quantile")
# assign colors to classes from classInterval object
colorCode <- findColours(class, plotColor)

# plot
plot(rw_start_goal_stan)
plot(rw_start_goal_stan, col = colorCode, add = TRUE)

# specify the location of the legend, change -117 & 44 to numbers that fit your data
legend(-117, 44, legend = names(attr(colorCode, "table")),
  fill = attr(colorCode, "palette"), cex = 0.8, bty = "n")

来源:在R中使用地图

这种方法对我来说很有意义,但是结果的图表不正确。 - a.urbanite
1
啊是的,当然,抱歉,这里是数据。如果您有一分钟的时间看一下,或者其他人有想法,我会非常感激!https://drive.google.com/file/d/1mgH3p-_JuMGHzVBDmNfECz6SdkO15Fpj/view?usp=sharing - a.urbanite

网页内容由stack overflow 提供, 点击上面的
可以查看英文原文,
原文链接