在R中获取一组点的上凸壳

3

我正在尝试获取与生产率数据相关的一组点的上凸壳,用于R语言。 我期望它是一个具有递减规模收益的函数,输入为工作时数,输出为工作完成量的度量。 我想要上凸壳是因为这将使我得到效率前沿。

我已经在R中找到了chull方法,但这只给出整个包络中的点集而不仅仅是上凸壳点。 有没有办法在R中自动选择上凸壳点?
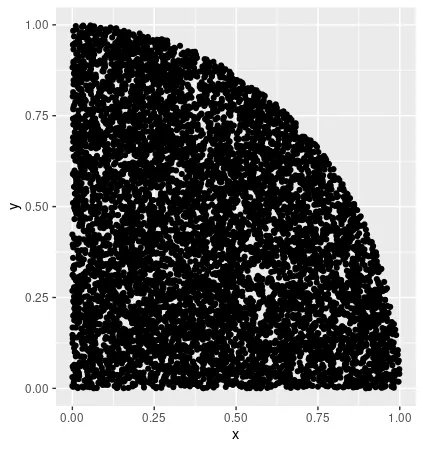
例如,我们可以在生成的圆中找到上凸壳。

library(ggplot2)
# Generate random uniformly spaced points in the square space between (0,0) and (1,1)
x <- runif(10000, min = 0, max = 1)
y <- runif(10000, min = 0, max = 1)
df <- tibble(x,y)
# Filter out the points that don't lie inside a circle of radius 1
df %>% filter(!(x^2+y^2>1)) -> df
# Plot all the points in the above dataframe
ggplot(df, aes(x=x, y=y)) + geom_point()
# Compute the convex hull of the above points
newdf <- df[chull(df$x, df$y),]
# Plot the convex hull
ggplot(newdf, aes(x=x, y=y)) + geom_point()
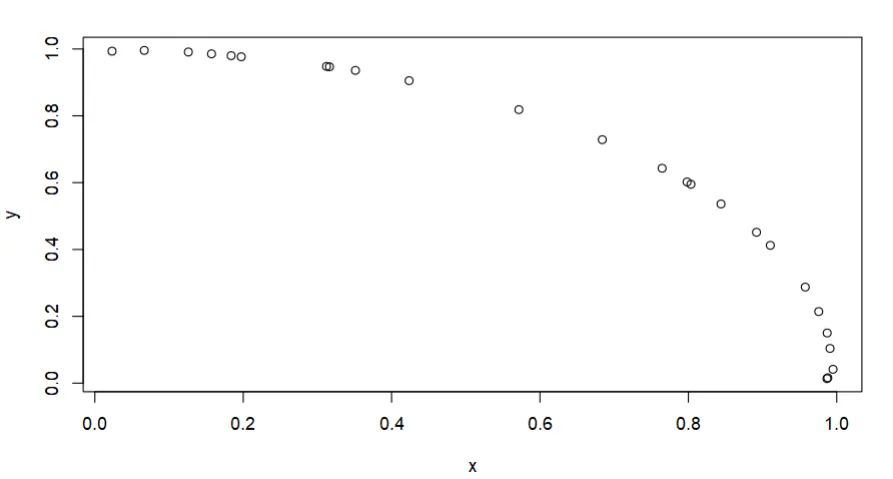
完整的图像如下所示 圆内所有点 凸包看起来像这样 上述点的凸包 
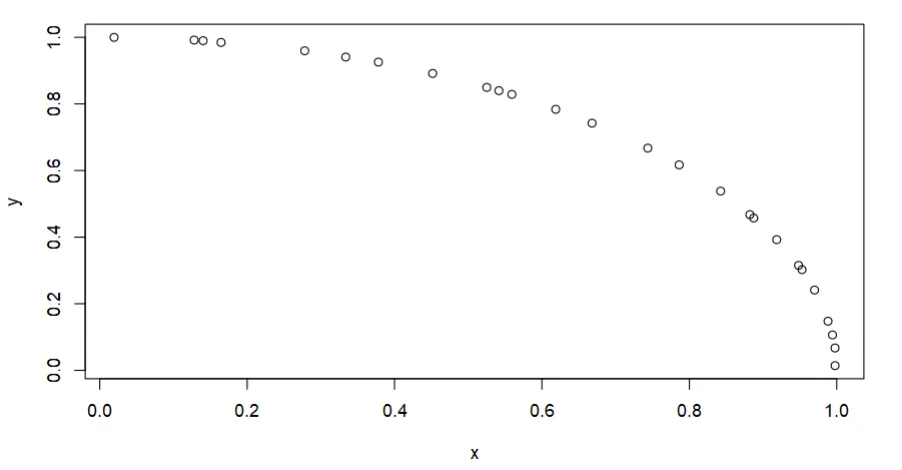
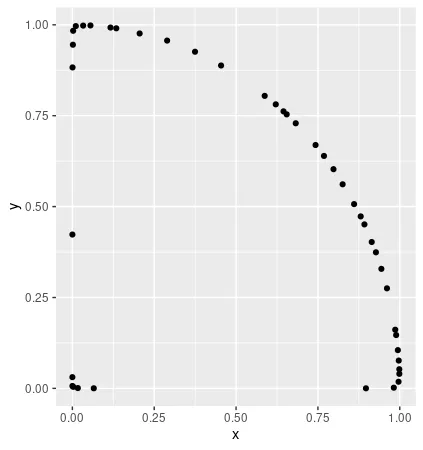
在这个例子中,上侧壳应该只给我圆形的曲线部分,而不是坐标轴。

将您的数据分成不同的区间(例如使用
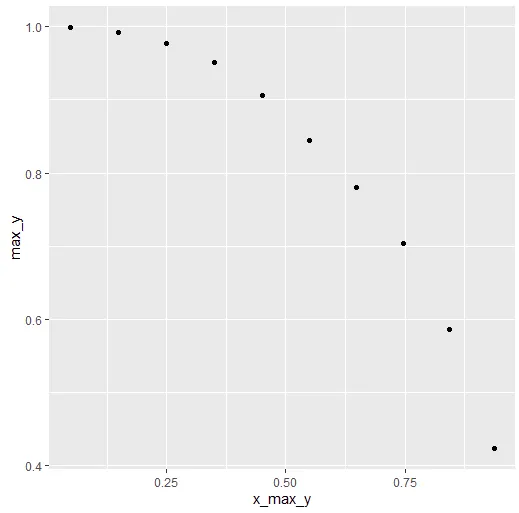
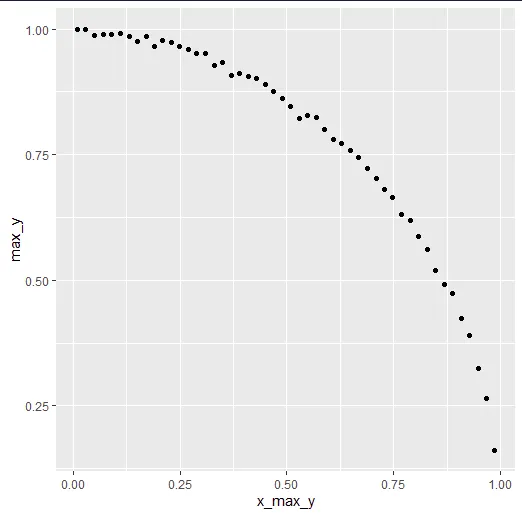
cut()函数),并选择每个区间内的最大值? - Wimpel
你能详细解释一下吗? - Sarthak Nigam
2个回答

2
这里提供一种方法,即将x轴划分成小块,然后计算每个块的平均值(mean(x))和最大值(max(y))。您可以增加/减少块的数量,以获得更平滑(或更详细)的曲线。
library(tidyverse)
df %>%
  mutate(bin = cut(x, 10)) %>%  # !! <-- increase/decrease value
  group_by(bin) %>%
  summarise(max_y = max(y, na.rm = TRUE),
            x_max_y = mean(x, na.rm = TRUE)) %>%
  ggplot(aes(x = x_max_y, y = max_y)) + geom_point()

enter image description here

用50个箱子

enter image description here


谢谢!这是一个不错的方法。我会保持这个问题未回答一段时间,以防有人知道R中已经实现的方法。 - Sarthak Nigam

1
在这种情况下,您可以选择在线1 - x上方的点。
plot(newdf[newdf$y > 1 - newdf$x, ])

另一种逼近上凸壳的方法是更改您的初始过滤方法,只获取介于1和0.995之间的值,然后获取凸壳:

enter image description here


df <- with(df, df[(x^2+y^2 < 1 & x^2+y^2 > 0.995),])
plot(df[chull(df$x, df$y),])

enter image description here


1
谢谢,但我只是举例子。我真的在尝试解决一个通用情况,因为我拥有的数据在不同的时间点具有不同种类的随机分布。 - Sarthak Nigam

网页内容由stack overflow 提供, 点击上面的
可以查看英文原文,
原文链接