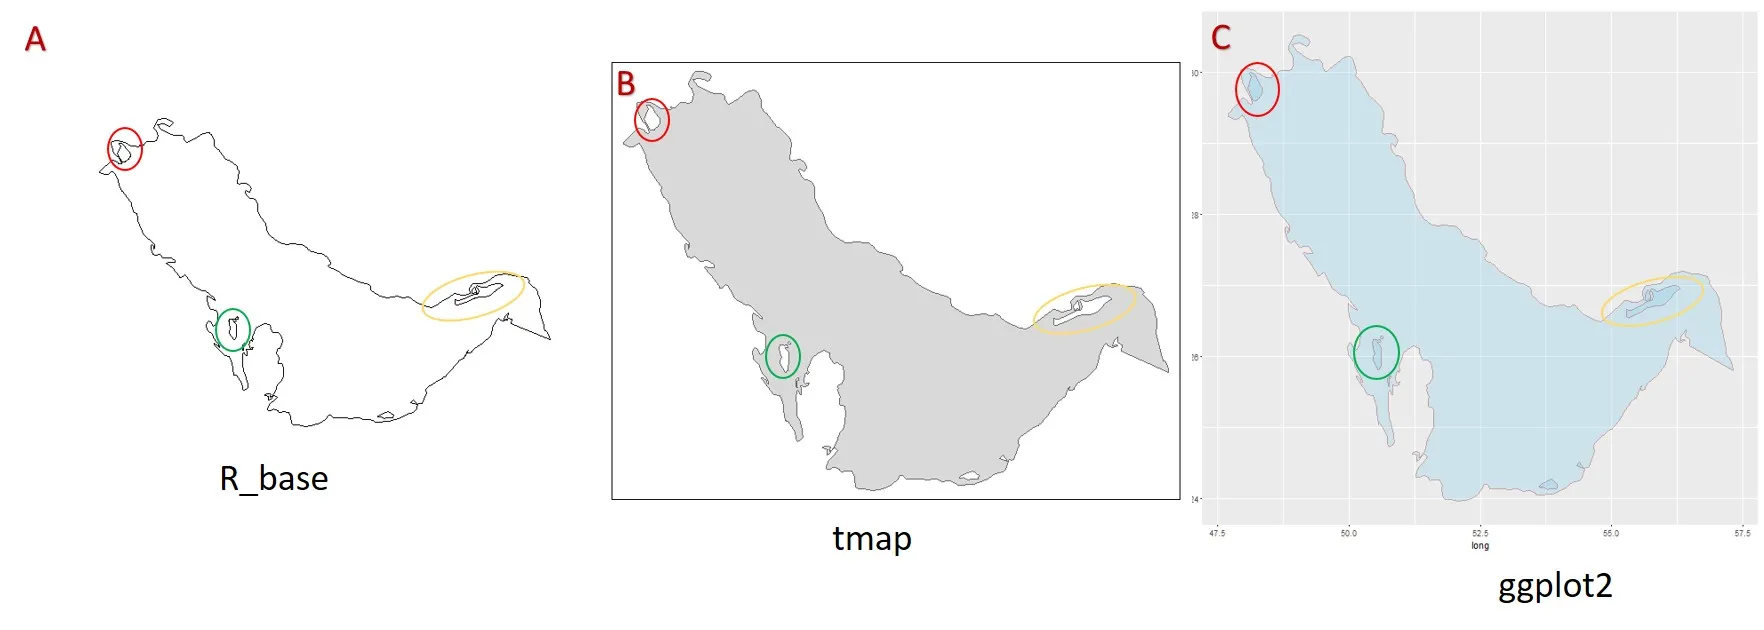
除了@AdamMccurdy的答案之外,还有一些可能性可以使岛屿和相邻背景颜色相同。
第一种方法是将岛屿的填充颜色和背景色设置为相同。但是网格线在多边形下方,因此消失了。
第二种方法是试图恢复网格线。它将背景(包括网格线)绘制在面板顶部(使用panel.ontop = TRUE)。但需要调整alpha值来使背景和岛屿颜色相同。
第三种方法是将背景和岛屿颜色设置为相同(与第一种方法相同),然后在面板顶部绘制网格线。有几种方法可以实现这一点;在这里,我从原始绘图中获取网格线grob,然后将其绘制在面板顶部。因此颜色保持不变,无需使用alpha透明度。
library(ggplot2)
library (rgdal)
library (rgeos)
library(maptools)

PG <- readOGR("iho.shp", layer = "iho")
AG <- fortify(PG)
方法一
bg = "grey92"
ggplot() +
   geom_polygon(data = AG, aes(long, lat, group = group, fill = hole),
      colour = alpha("darkred", 1/2), size = 0.7) +
   scale_fill_manual(values = c("skyblue", bg)) +
   theme(panel.background = element_rect(fill = bg),
         legend.position = "none")
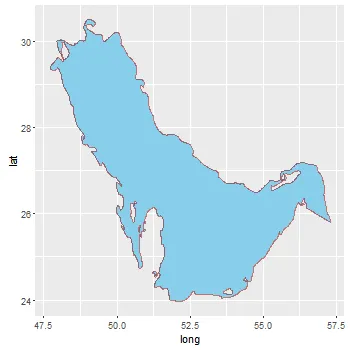
方法2
这是一张图片,无法进行翻译。
ggplot() +
   geom_polygon(data = AG, aes(long, lat, group = group, fill = hole),
      colour = alpha("darkred", 1/2), size = 0.7) +
   scale_fill_manual(values = c("skyblue", "grey97")) +
   theme(panel.background = element_rect(fill = alpha("grey85", .5)),
         panel.ontop = TRUE,
         legend.position = "none")
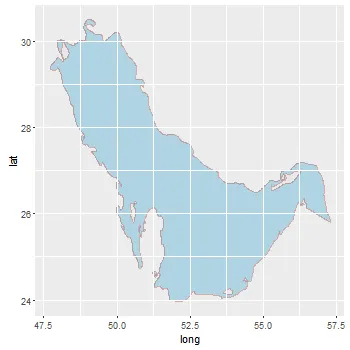
方法三
对于 ggplot 3.0.0 版本进行了小编辑的更新。
library(grid)
bg <- "grey92"
p <- ggplot() +
geom_polygon(data = AG, aes(long, lat, group = group, fill = hole),
colour = alpha("darkred", 1/2), size = 0.7) +
scale_fill_manual(values = c("skyblue", bg)) +
theme(panel.background = element_rect(fill = bg),
legend.position = "none")
g <- ggplotGrob(p)
grill <- g[7,5]$grobs[[1]]$children[[1]]
grill$children[[1]] <- nullGrob()
p
downViewport("panel.7-5-7-5")
grid.draw(grill)
upViewport(0)
但是这个版本可能更加强大,能够适应ggplot的变化
library(grid)
bg <- "grey92"
p <- ggplot() +
geom_polygon(data = AG, aes(long, lat, group = group, fill = hole),
colour = alpha("darkred", 1/2), size = 0.7) +
scale_fill_manual(values = c("skyblue", bg)) +
theme(panel.background = element_rect(fill = bg),
legend.position = "none")
g <- ggplotGrob(p)
grill <- getGrob(grid.force(g), gPath("grill"), grep = TRUE)
grill = removeGrob(grill, gPath("background"), grep = TRUE)
names = grid.ls(grid.force(g))$name
match = grep("panel.\\d", names, value = TRUE)
grid.newpage(); grid.draw(g)
downViewport(match)
grid.draw(grill)
upViewport(0)

 。
。
values = c("skyblue", alpha("white", .5))为每种颜色设置单独的透明度。不幸的是,ggplot首先绘制大多边形,然后在上面绘制孔和分离的多边形,因此如果您增加白色的透明度,您只会看到天蓝色下面而不是实际的网格。您可以将岛屿更改为与背景相同的颜色,但您将无法获得网格线。另一个想法是类似于Arc中的擦除功能。 - admccurdy