多个ggplot线性回归线

5

我正在绘制一种物种的出现情况,根据同一图表上的多个变量。虽然还有许多其他变量,但为了本帖子的缘故,我只保留了重要的变量:

 > str(GH) 
 'data.frame':  288 obs. of  21 variables: 
 $ Ee       : int  2 2 1 7 6 3 0 9 3 7 ... 
 $ height   : num  14 25.5 25 21.5 18.5 36 18 31.5 28.5 19 ... 
 $ legumes  : num  0 0 55 30 0 0 55 10 30 0 ... 
 $ grass    : num  60 50 30 35 40 35 40 40 35 30 ... 
 $ forbs    : num  40 70 40 50 65 70 40 65 70 70 ... 

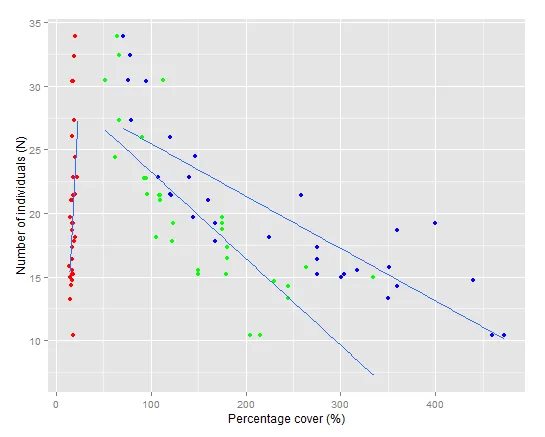
我已经成功地绘制了这个图表,并使用以下方法使其看起来很好(其中Ee是所讨论的物种):

ggplot(data=GH,aes(y=y,x=x),ylab="Number of individuals (N)",xlab="Percentage cover (%); OR  Height(cm))+
geom_jitter(aes(legumes,Ee),colour="blue")+ 
geom_jitter(aes(grass,Ee),colour="green")+ 
geom_jitter(aes(forbs,Ee),colour="red")+ 
geom_jitter(aes(height,Ee),colour="black") 

然而,我希望为每个变量添加回归线(并计算R平方值),但迄今为止没有成功。此外,坐标轴标签拒绝从X和Y更改,这是我以前从未遇到过的。有人能在这方面给我任何帮助吗?谢谢


你似乎想要像基础图形一样标记ggplot,但这样是行不通的。试试 + labs(x = "覆盖百分比(%)", y = "个体数量(N)") - Gregor Thomas
1个回答

14

使用ggplot2中的geom_smooth图形可以显示回归线。我正在使用mtcars数据集,因为它非常类似于您的数据集:

使用geom_smooth在ggplot2中绘制回归线。我使用mtcars数据集,因为它非常类似于你的数据集:

ggplot(mtcars) + 
  geom_jitter(aes(disp,mpg), colour="blue") + geom_smooth(aes(disp,mpg), method=lm, se=FALSE) +
  geom_jitter(aes(hp,mpg), colour="green") + geom_smooth(aes(hp,mpg), method=lm, se=FALSE) +
  geom_jitter(aes(qsec,mpg), colour="red") + geom_smooth(aes(qsec,mpg), method=lm, se=FALSE) +
  labs(x = "Percentage cover (%)", y = "Number of individuals (N)")

此外,我从 ggplot 中移除了 aes(y=y,x=x),因为它没有任何意义。结果如下:

enter image description here

也有更为复杂(但显示效果更佳)的方法可以使用 reshape2 包中的 melt 实现相同的功能:

require(ggplot2)
require(reshape2)
mtcars2 = melt(mtcars, id.vars='mpg')
ggplot(mtcars2) +
  geom_jitter(aes(value,mpg, colour=variable),) + geom_smooth(aes(value,mpg, colour=variable), method=lm, se=FALSE) +
  facet_wrap(~variable, scales="free_x") +
  labs(x = "Percentage cover (%)", y = "Number of individuals (N)")

这个解决方案的一个重要元素是选项scales="free_x",它允许在每个分面绘图中独立地缩放X轴。

输入图片说明


太好了!这正是我想做的!谢谢。第一次尝试ggplot。你知道我怎么能在每条线上添加R平方值吗?我已经使用Eeleg<-lm(Ee~legumes)等方法得到了这些值,但我想把它们放在图表上。 - user25002
1
这种方法是否可以包括相关系数、斜率和截距? - philiporlando
我尝试了以下代码来添加方程和R²,但是没有成功:stat_poly_eq(aes(label = paste(..eq.label.., ..rr.label.., sep = "~~~~")), label.x.npc = "right", label.y.npc = "bottom", formula = y~x, parse = TRUE, size = 2.8) - Marcel

网页内容由stack overflow 提供, 点击上面的
可以查看英文原文,
原文链接