Matplotlib:绘制圆并将其放大,以便圆内的文本不超出圆形边界。

3
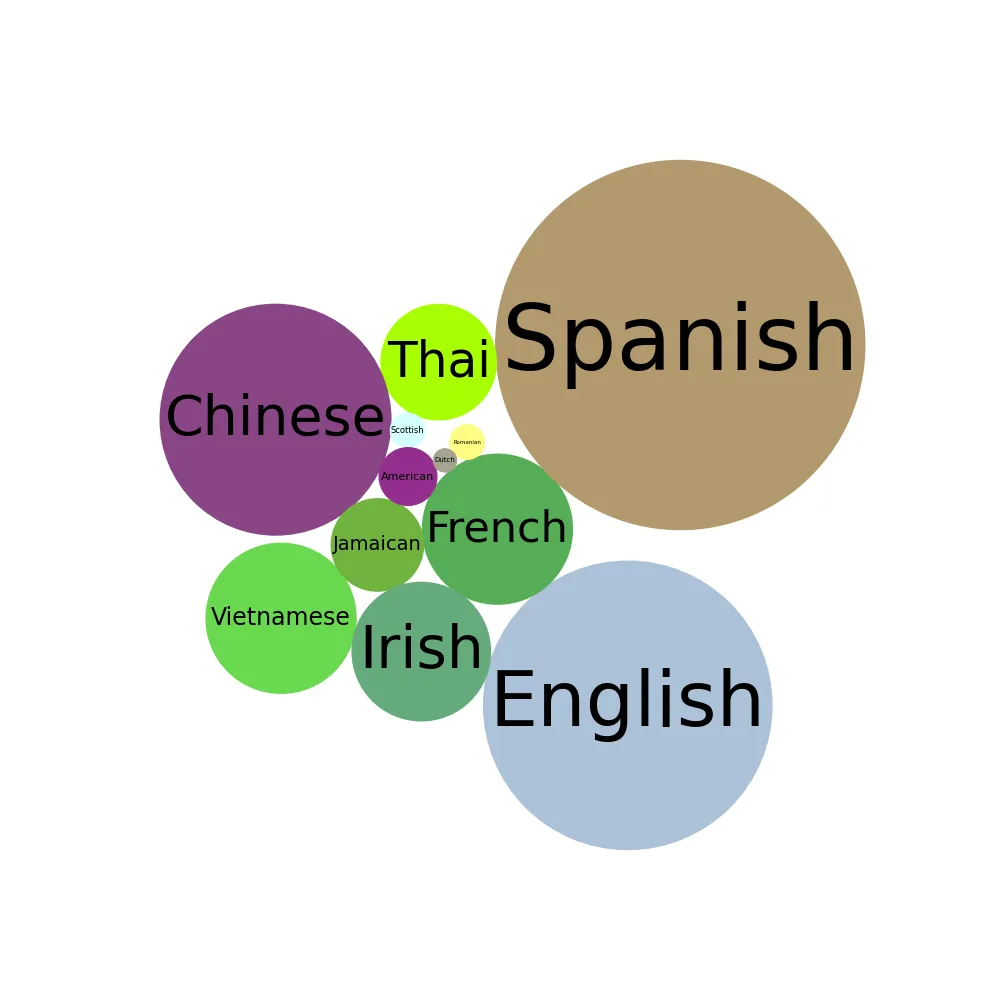
我有一些数据,其中包含语言和相关的单位大小。我想制作一个气泡图,然后将其导出到PGF。我从这个答案Making a non-overlapping bubble chart in Matplotlib (circle packing)中得到了大部分代码,但我的问题是我的文本超出了圆形边界: enter image description here 如何才能增加所有内容的比例(我认为这更容易),或者确保气泡大小始终大于内部文本(并且气泡仍然按照数据系列成比例)。我认为这更难做到,但我不真正需要那样做。
相关代码:
#!/usr/bin/env python3
import numpy as np
import matplotlib.pyplot as plt
import matplotlib.colors as mcolors

# create 10 circles with different radii
r = np.random.randint(5,15, size=10)
mapping = [("English", 25),
                    ("French", 13),
                    ("Spanish", 32),
                    ("Thai", 10),
                    ("Vientamese", 13),
                    ("Chinese", 20),
                    ("Jamaican", 8),
                    ("Scottish", 3),
                    ("Irish", 12),
                    ("American", 5),
                    ("Romanian", 3),
                    ("Dutch", 2)]

class C():
    def __init__(self,r):
        self.colors = list(mcolors.XKCD_COLORS)
        self.N = len(r)
        self.labels = [item[0] for item in r]
        self.x = np.ones((self.N,3))
        self.x[:,2] = [item[1] for item in r]
        maxstep = 2*self.x[:,2].max()
        length = np.ceil(np.sqrt(self.N))
        grid = np.arange(0,length*maxstep,maxstep)
        gx,gy = np.meshgrid(grid,grid)
        self.x[:,0] = gx.flatten()[:self.N]
        self.x[:,1] = gy.flatten()[:self.N]
        self.x[:,:2] = self.x[:,:2] - np.mean(self.x[:,:2], axis=0)

        self.step = self.x[:,2].min()
        self.p = lambda x,y: np.sum((x**2+y**2)**2)
        self.E = self.energy()
        self.iter = 1.

    def minimize(self):
        while self.iter < 1000*self.N:
            for i in range(self.N):
                rand = np.random.randn(2)*self.step/self.iter
                self.x[i,:2] += rand
                e = self.energy()
                if (e < self.E and self.isvalid(i)):
                    self.E = e
                    self.iter = 1.
                else:
                    self.x[i,:2] -= rand
                    self.iter += 1.

    def energy(self):
        return self.p(self.x[:,0], self.x[:,1])

    def distance(self,x1,x2):
        return np.sqrt((x1[0]-x2[0])**2+(x1[1]-x2[1])**2)-x1[2]-x2[2]

    def isvalid(self, i):
        for j in range(self.N):
            if i!=j:
                if self.distance(self.x[i,:], self.x[j,:]) < 0:
                    return False
        return True

    def scale(self, size):
        """Scales up the plot"""
        self.x = self.x*size

    def plot(self, ax):
        for i in range(self.N):
            circ = plt.Circle(self.x[i,:2],self.x[i,2], color=mcolors.XKCD_COLORS[self.colors[i]])
            ax.add_patch(circ)
            ax.text(self.x[i][0],self.x[i][1], self.labels[i], horizontalalignment='center', size='medium', color='black', weight='semibold')

c = C(mapping)

fig, ax = plt.subplots(subplot_kw=dict(aspect="equal"))
ax.axis("off")

c.minimize()

c.plot(ax)
ax.relim()
ax.autoscale_view()
plt.show()
1个回答

3
我认为你所概述的两种方法基本上是等效的。在这两种情况下,您都必须确定文本框的大小与圆的大小的关系。对于matplotlib文本对象获取精确边界框是棘手的问题,因为渲染文本对象是由后端完成的,而不是matplotlib本身完成的。因此,您必须呈现文本对象,获取其边界框,计算当前和期望边界之间的比率,删除文本对象,最后通过先前计算的比率重新呈现文本缩放。由于边界框计算及其重新缩放对于非常小和非常大的文本对象来说非常不准确,因此您实际上必须多次重复此过程(下面我做了两次,这是最少的)。
关于圆的放置,我还改用了适当的最小化替换了您在能量景观中的随机游走。这样更快,我认为结果更好。

enter image description here

#!/usr/bin/env python3
import numpy as np
import matplotlib.pyplot as plt
import matplotlib.colors as mcolors

from scipy.optimize import minimize, NonlinearConstraint
from scipy.spatial.distance import pdist, squareform


def _get_fontsize(size, label, ax, *args, **kwargs):
    """Given a circle, precompute the fontsize for a text object such that it fits the circle snuggly.

    Parameters
    ----------
    size : float
        The radius of the circle.
    label : str
        The string.
    ax : matplotlib.axis object
        The matplotlib axis.
    *args, **kwargs
        Passed to ax.text().

    Returns
    -------
    fontsize : float
        The estimated fontsize.
    """

    default_fontsize = kwargs.setdefault('size', plt.rcParams['font.size'])
    width, height = _get_text_object_dimensions(ax, label, *args, **kwargs)
    initial_estimate = size / (np.sqrt(width**2 + height**2) / 2) * default_fontsize
    kwargs['size'] = initial_estimate
    # Repeat process as bbox estimates are bad for very small and very large bboxes.
    width, height = _get_text_object_dimensions(ax, label, *args, **kwargs)
    return size / (np.sqrt(width**2 + height**2) / 2) * initial_estimate


def _get_text_object_dimensions(ax, string, *args, **kwargs):
    """Precompute the dimensions of a text object on a given axis in data coordinates.

    Parameters
    ----------
    ax : matplotlib.axis object
        The matplotlib axis.
    string : str
        The string.
    *args, **kwargs
        Passed to ax.text().

    Returns
    -------
    width, height : float
        The dimensions of the text box in data units.
    """

    text_object = ax.text(0., 0., string, *args, **kwargs)
    renderer = _find_renderer(text_object.get_figure())
    bbox_in_display_coordinates = text_object.get_window_extent(renderer)
    bbox_in_data_coordinates = bbox_in_display_coordinates.transformed(ax.transData.inverted())
    w, h = bbox_in_data_coordinates.width, bbox_in_data_coordinates.height
    text_object.remove()
    return w, h


def _find_renderer(fig):
    """
    Return the renderer for a given matplotlib figure.

    Notes
    -----
    Adapted from https://dev59.com/vWEh5IYBdhLWcg3wNxLM#22689498
    """

    if hasattr(fig.canvas, "get_renderer"):
        # Some backends, such as TkAgg, have the get_renderer method, which
        # makes this easy.
        renderer = fig.canvas.get_renderer()
    else:
        # Other backends do not have the get_renderer method, so we have a work
        # around to find the renderer. Print the figure to a temporary file
        # object, and then grab the renderer that was used.
        # (I stole this trick from the matplotlib backend_bases.py
        # print_figure() method.)
        import io
        fig.canvas.print_pdf(io.BytesIO())
        renderer = fig._cachedRenderer
    return(renderer)


class BubbleChart:

    def __init__(self, sizes, colors, labels, ax=None, **font_kwargs):
        # TODO: input sanitation

        self.sizes = np.array(sizes)
        self.labels = labels
        self.colors = colors
        self.ax = ax if ax else plt.gca()

        self.positions = self._initialize_positions(self.sizes)
        self.positions = self._optimize_positions(self.positions, self.sizes)
        self._plot_bubbles(self.positions, self.sizes, self.colors, self.ax)

        # NB: axis limits have to be finalized before computing fontsizes
        self._rescale_axis(self.ax)

        self._plot_labels(self.positions, self.sizes, self.labels, self.ax, **font_kwargs)


    def _initialize_positions(self, sizes):
        # TODO: try different strategies; set initial positions to lie
        # - on a circle
        # - on concentric shells, larger bubbles on the outside
        return np.random.rand(len(sizes), 2) * np.min(sizes)


    def _optimize_positions(self, positions, sizes):
        # Adapted from: https://dev59.com/m7jna4cB1Zd3GeqP6jr6#73353731

        def cost_function(new_positions, old_positions):
            return np.sum((new_positions.reshape((-1, 2)) - old_positions)**2)

        def constraint_function(x):
            x = np.reshape(x, (-1, 2))
            return pdist(x)

        lower_bounds = sizes[np.newaxis, :] + sizes[:, np.newaxis]
        lower_bounds -= np.diag(np.diag(lower_bounds)) # squareform requires zeros on diagonal
        lower_bounds = squareform(lower_bounds)

        nonlinear_constraint = NonlinearConstraint(constraint_function, lower_bounds, np.inf, jac='2-point')
        result = minimize(lambda x: cost_function(x, positions), positions.flatten(), method='SLSQP',
                        jac="2-point", constraints=[nonlinear_constraint])
        return result.x.reshape((-1, 2))


    def _plot_bubbles(self, positions, sizes, colors, ax):
        for (x, y), radius, color in zip(positions, sizes, colors):
            ax.add_patch(plt.Circle((x, y), radius, color=color))


    def _rescale_axis(self, ax):
        ax.relim()
        ax.autoscale_view()
        ax.get_figure().canvas.draw()


    def _plot_labels(self, positions, sizes, labels, ax, **font_kwargs):
        font_kwargs.setdefault('horizontalalignment', 'center')
        font_kwargs.setdefault('verticalalignment', 'center')

        for (x, y), label, size in zip(positions, labels, sizes):
            fontsize = _get_fontsize(size, label, ax, **font_kwargs)
            ax.text(x, y, label, size=fontsize, **font_kwargs)


if __name__ == '__main__':

    mapping = [("English", 25),
               ("French", 13),
               ("Spanish", 32),
               ("Thai", 10),
               ("Vietnamese", 13),
               ("Chinese", 20),
               ("Jamaican", 8),
               ("Scottish", 3),
               ("Irish", 12),
               ("American", 5),
               ("Romanian", 3),
               ("Dutch", 2)]

    labels = [item[0] for item in mapping]
    sizes = [item[1] for item in mapping]
    colors = list(mcolors.XKCD_COLORS)

    fig, ax = plt.subplots(figsize=(10, 10), subplot_kw=dict(aspect="equal"))
    bc = BubbleChart(sizes, colors, labels, ax=ax)
    ax.axis("off")
    plt.show()

网页内容由stack overflow 提供, 点击上面的
可以查看英文原文,
原文链接