这是关于文章的参考:https://github.com/PhilJay/MPAndroidChart/wiki/Setting-Data,标题为柱形图。在下面给出的代码中:
@Override
public View onCreateView(LayoutInflater inflater, ViewGroup container, Bundle savedInstanceState) {
View view = inflater.inflate(R.layout.fragment_graph_test, container, false);
BarChart chart = view.findViewById(R.id.bar_Chart_test);
List<BarEntry> entries = new ArrayList<>();
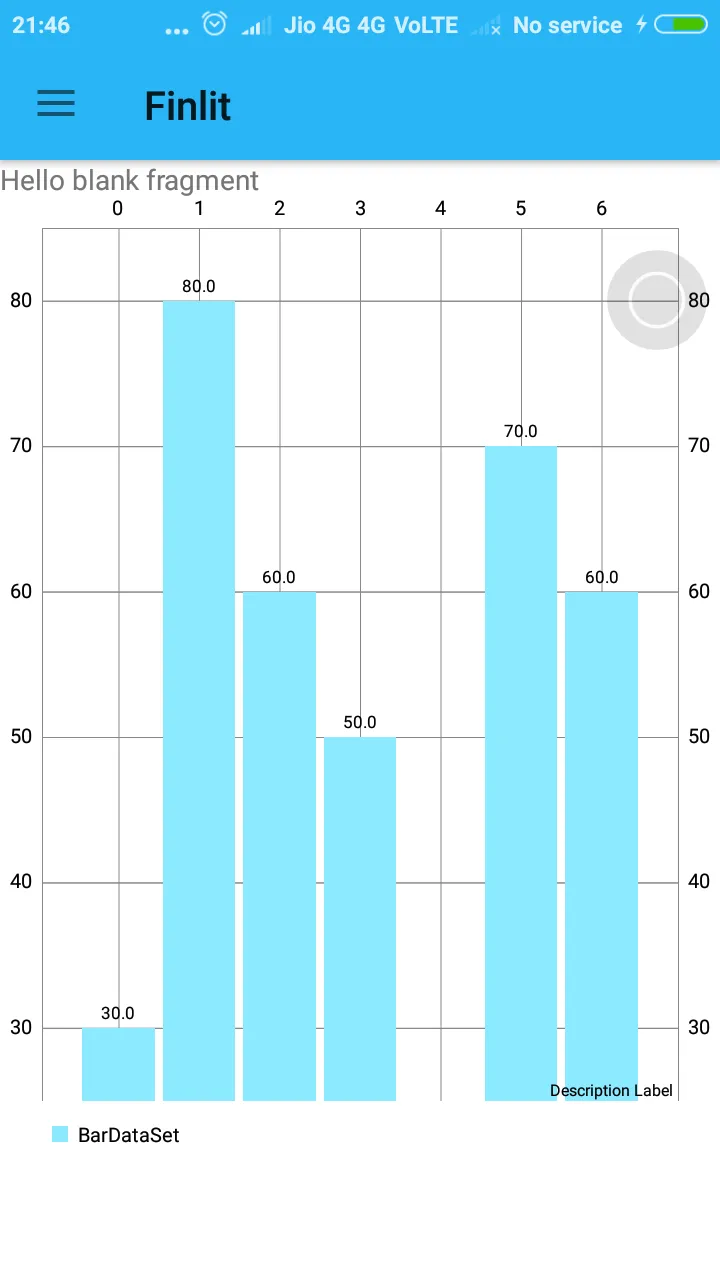
entries.add(new BarEntry(0f, 30f));
entries.add(new BarEntry(1f, 80f));
entries.add(new BarEntry(2f, 60f));
entries.add(new BarEntry(3f, 50f));
// gap of 2f
entries.add(new BarEntry(5f, 70f));
entries.add(new BarEntry(6f, 60f));
BarDataSet set = new BarDataSet(entries, "BarDataSet");
BarData data = new BarData(set);
data.setBarWidth(0.9f); // set custom bar width
chart.setData(data);
chart.setFitBars(true); // make the x-axis fit exactly all bars
chart.invalidate(); // refresh
return view;
}
输出结果如下:
此处未显示X值。点击此处查看截图
如何将X轴的值设置为按月份显示(1月1日,2月1日,3月1日...),与文章中所示相同。