当我正在编写我的示例时,我偶然发现了使用 'gdistance' r包的答案...希望其他人会发现这很有用。
library(gdistance)
library(sp)
library(ggplot2)
spdf <- SpatialPixelsDataFrame(points = img[c("x","y")], data = img["v"])
r <- rasterFromXYZ(spdf)
tl <- transition(r, function(x) min(x), 8)
sPath <- shortestPath(tl, c(0,0), c(12,-5), output = "SpatialLines")
sldf <- fortify(SpatialLinesDataFrame(sPath, data = data.frame(ID = 1)))
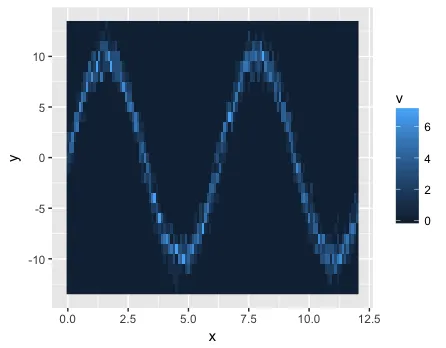
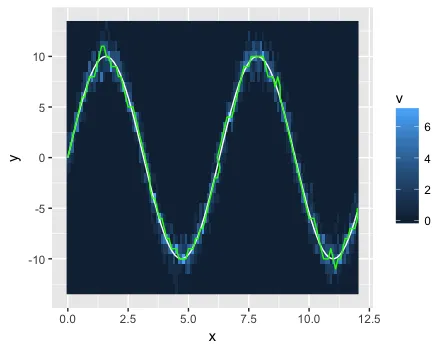
ggplot(img) +
geom_raster(aes(x=x,y=y,fill=v)) +
stat_function(data=img, aes(x=x), fun = function(x) 10*sin(x), geom="line", color="white") +
geom_path(data=sldf, aes(x=long,y=lat), color="green")
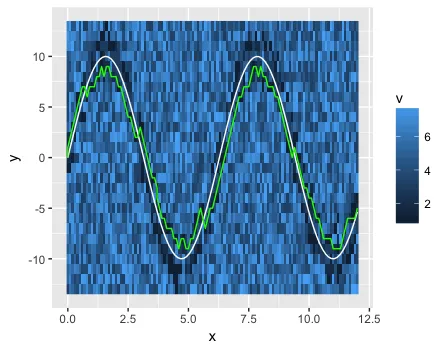
我想确保我不是在给自己一个太简单的问题...所以我制作了一张更嘈杂的图像。
img2 <- img
img2$v <- ifelse(img2$v==0, runif(sum(img2$v==0),3,8), img2$v)
spdf2 <- SpatialPixelsDataFrame(points = img2[c("x","y")], data = img2["v"])
r2 <- rasterFromXYZ(spdf2)
tl2 <- transition(r2, function(x) 1/mean(x), 8)
sPath2 <- shortestPath(tl2, c(0,0), c(12,-5), output = "SpatialLines")
sldf2 <- fortify(SpatialLinesDataFrame(sPath2, data = data.frame(ID = 1)))
ggplot(img2) +
geom_raster(aes(x=x,y=y,fill=v)) +
stat_function(data=img2, aes(x=x), fun = function(x) 10*sin(x), geom="line", color="white") +
geom_path(data=sldf2, aes(x=long,y=lat), color="green")
更新:使用真实栅格数据...
我想测试同样的工作流程是否能在实际的真实世界栅格图像上运行,而不仅仅是虚假数据,所以...
library(jpeg)
url <- "https://c8.alamy.com/comp/AMDPJ6/fiji-big-island-winding-river-aerial-AMDPJ6.jpg"
download.file(url, "river.jpg", mode = "wb")
jpg <- readJPEG("./river.jpg")
img3 <- melt(jpg, varnames = c("y","x","rgb"))
img3$rgb <- as.character(factor(img3$rgb, levels = c(1,2,3), labels=c("r","g","b")))
img3 <- dcast(img3, x + y ~ rgb)
img3$v <- img3$r*.21 + img3$g*.72 + img3$b*.07
要将 RGB 转换为灰度,请参见:https://dev59.com/Zobca4cB1Zd3GeqPRRVN#27491947
pts_df <- data.frame(x = c(920, 500),
y = c(880, 50))
ref_val <- mean(c(subset(img3, x==pts_df[1,1] & y==pts_df[1,2])$v,
subset(img3, x==pts_df[2,1] & y==pts_df[2,2])$v))
spdf3 <- SpatialPixelsDataFrame(points = img3[c("x","y")], data = img3["v"])
r3 <- rasterFromXYZ(spdf3)
tl3 <- transition(r3, function(x) (1/max(abs((x/ref_val)-1))^2)-1, 8)
sPath3 <- shortestPath(tl3, as.numeric(pts_df[1,]), as.numeric(pts_df[2,]), output = "SpatialLines")
sldf3 <- fortify(SpatialLinesDataFrame(sPath3, data = data.frame(ID = 1)))
ggplot(img3) +
geom_raster(aes(x,y, fill=v)) +
scale_fill_continuous(high="white", low="black") +
scale_y_reverse() +
geom_point(data=pts_df, aes(x,y), color="red") +
geom_path(data=sldf3, aes(x=long,y=lat), color="green")
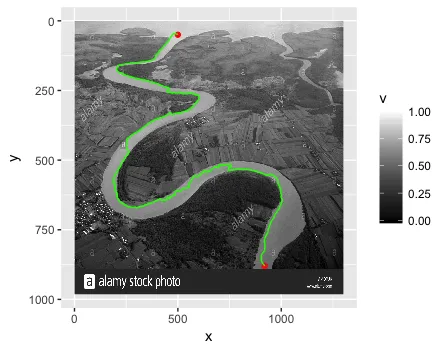
在找到有效的过渡函数之前,我尝试了许多不同的函数。这个函数可能比必要的复杂,但它是有效的。你可以增加幂次项(从2变为3、4、5、6……),它仍然有效。如果去掉幂次项,它就无法得出正确的解。
使用igraph包的替代方案。
发现了一组使用 'igraph' r 包的替代答案。我认为需要注意的一个重要区别是,'igraph' 支持 n 维图形,而 'gdistance' 仅支持 2D 图形。因此,例如将此答案扩展到 3D 相对容易。
library(igraph)
l <- make_lattice(dimvector = c(length(unique(img$y)),
length(unique(img$x))), directed=F, circular=F)
summary(l)
V(l)$x = img$x
V(l)$y = img$y
V(l)$v = img$v
V(l)$color = grey.colors(length(unique(img$v)))[img$v+1]
el <- get.edgelist(l)
E(l)$weight <- 1/(pmax(V(l)[el[, 1]]$v, V(l)[el[, 2]]$v))
E(l)$color = grey.colors(length(unique(E(l)$weight)))[E(l)$weight+1]
感谢https://stackoverflow.com/a/27446127/2371031提供的边权重计算方法!
start = V(l)[V(l)$x == 0 & V(l)$y == 0]
end = V(l)[V(l)$x == 12 & V(l)$y == -5]
result <- shortest_paths(graph = l, from = start, to = end, output = "both")
V(l)$color = ifelse(V(l) %in% result$vpath[[1]], "green", V(l)$color)
E(l)$color = ifelse(E(l) %in% result$epath[[1]], "green", E(l)$color)
V(l)$color = ifelse(V(l) %in% c(start,end), "red", V(l)$color)
plot(l, vertex.shape = "square", vertex.size=2, vertex.frame.color=NA, vertex.label=NA, curved=F)
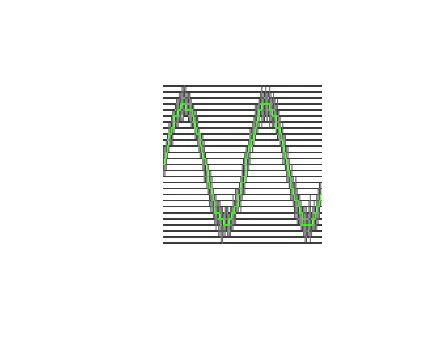
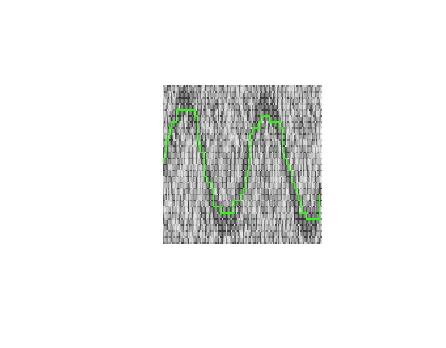
第二个(更嘈杂的)示例需要使用不同的公式来计算边缘权重。
img2 <- img
img2$v <- ifelse(img2$v==0, runif(sum(img2$v==0),3,8), img2$v)
l <- make_lattice(dimvector = c(length(unique(img2$y)),
length(unique(img2$x))), directed=F, circular=F)
V(l)$x = img2$x
V(l)$y = img2$y
V(l)$v = img2$v
V(l)$color = grey.colors(length(unique(img2$v)))[factor(img2$v)]
el <- get.edgelist(l)
E(l)$weight <- (pmin(V(l)[el[, 1]]$v, V(l)[el[, 2]]$v))
E(l)$color = grey.colors(length(unique(E(l)$weight)))[factor(E(l)$weight)]
start = V(l)[V(l)$x == 0 & V(l)$y == 0]
end = V(l)[V(l)$x == 12 & V(l)$y == -5]
result <- shortest_paths(graph = l, from = start, to = end, output = "both")
V(l)$color = ifelse(V(l) %in% result$vpath[[1]], "green", V(l)$color)
E(l)$color = ifelse(E(l) %in% result$epath[[1]], "green", E(l)$color)
V(l)$color = ifelse(V(l) %in% c(start,end), "red", V(l)$color)
plot(l, vertex.shape = "square", vertex.size=2, vertex.frame.color=NA, vertex.label=NA, curved=F)