从matplotlib AxesSubplot获取值

9

我想从matplotlib.axes.AxesSubplot中获取值,该对象是从pandas.Series.hist方法返回的。 有没有方法可以这样做?我在列表中找不到相应的属性。

import pandas as pd
import matplotlib.pyplot as plt

serie = pd.Series([0.0,950.0,-70.0,812.0,0.0,-90.0,0.0,0.0,-90.0,0.0,-64.0,208.0,0.0,-90.0,0.0,-80.0,0.0,0.0,-80.0,-48.0,840.0,-100.0,190.0,130.0,-100.0,-100.0,0.0,-50.0,0.0,-100.0,-100.0,0.0,-90.0,0.0,-90.0,-90.0,63.0,-90.0,0.0,0.0,-90.0,-80.0,0.0,])
hist = serie.hist()
# I want to get values of hist variable.

我知道我可以使用np.histogram来获取直方图值,但我想使用pandas的hist方法。

1
我不确定这是否可能:Pandas的plotting.py源代码似乎会丢弃matplotlib返回给它的分组数据、分组边缘和补丁对象。为什么不直接使用
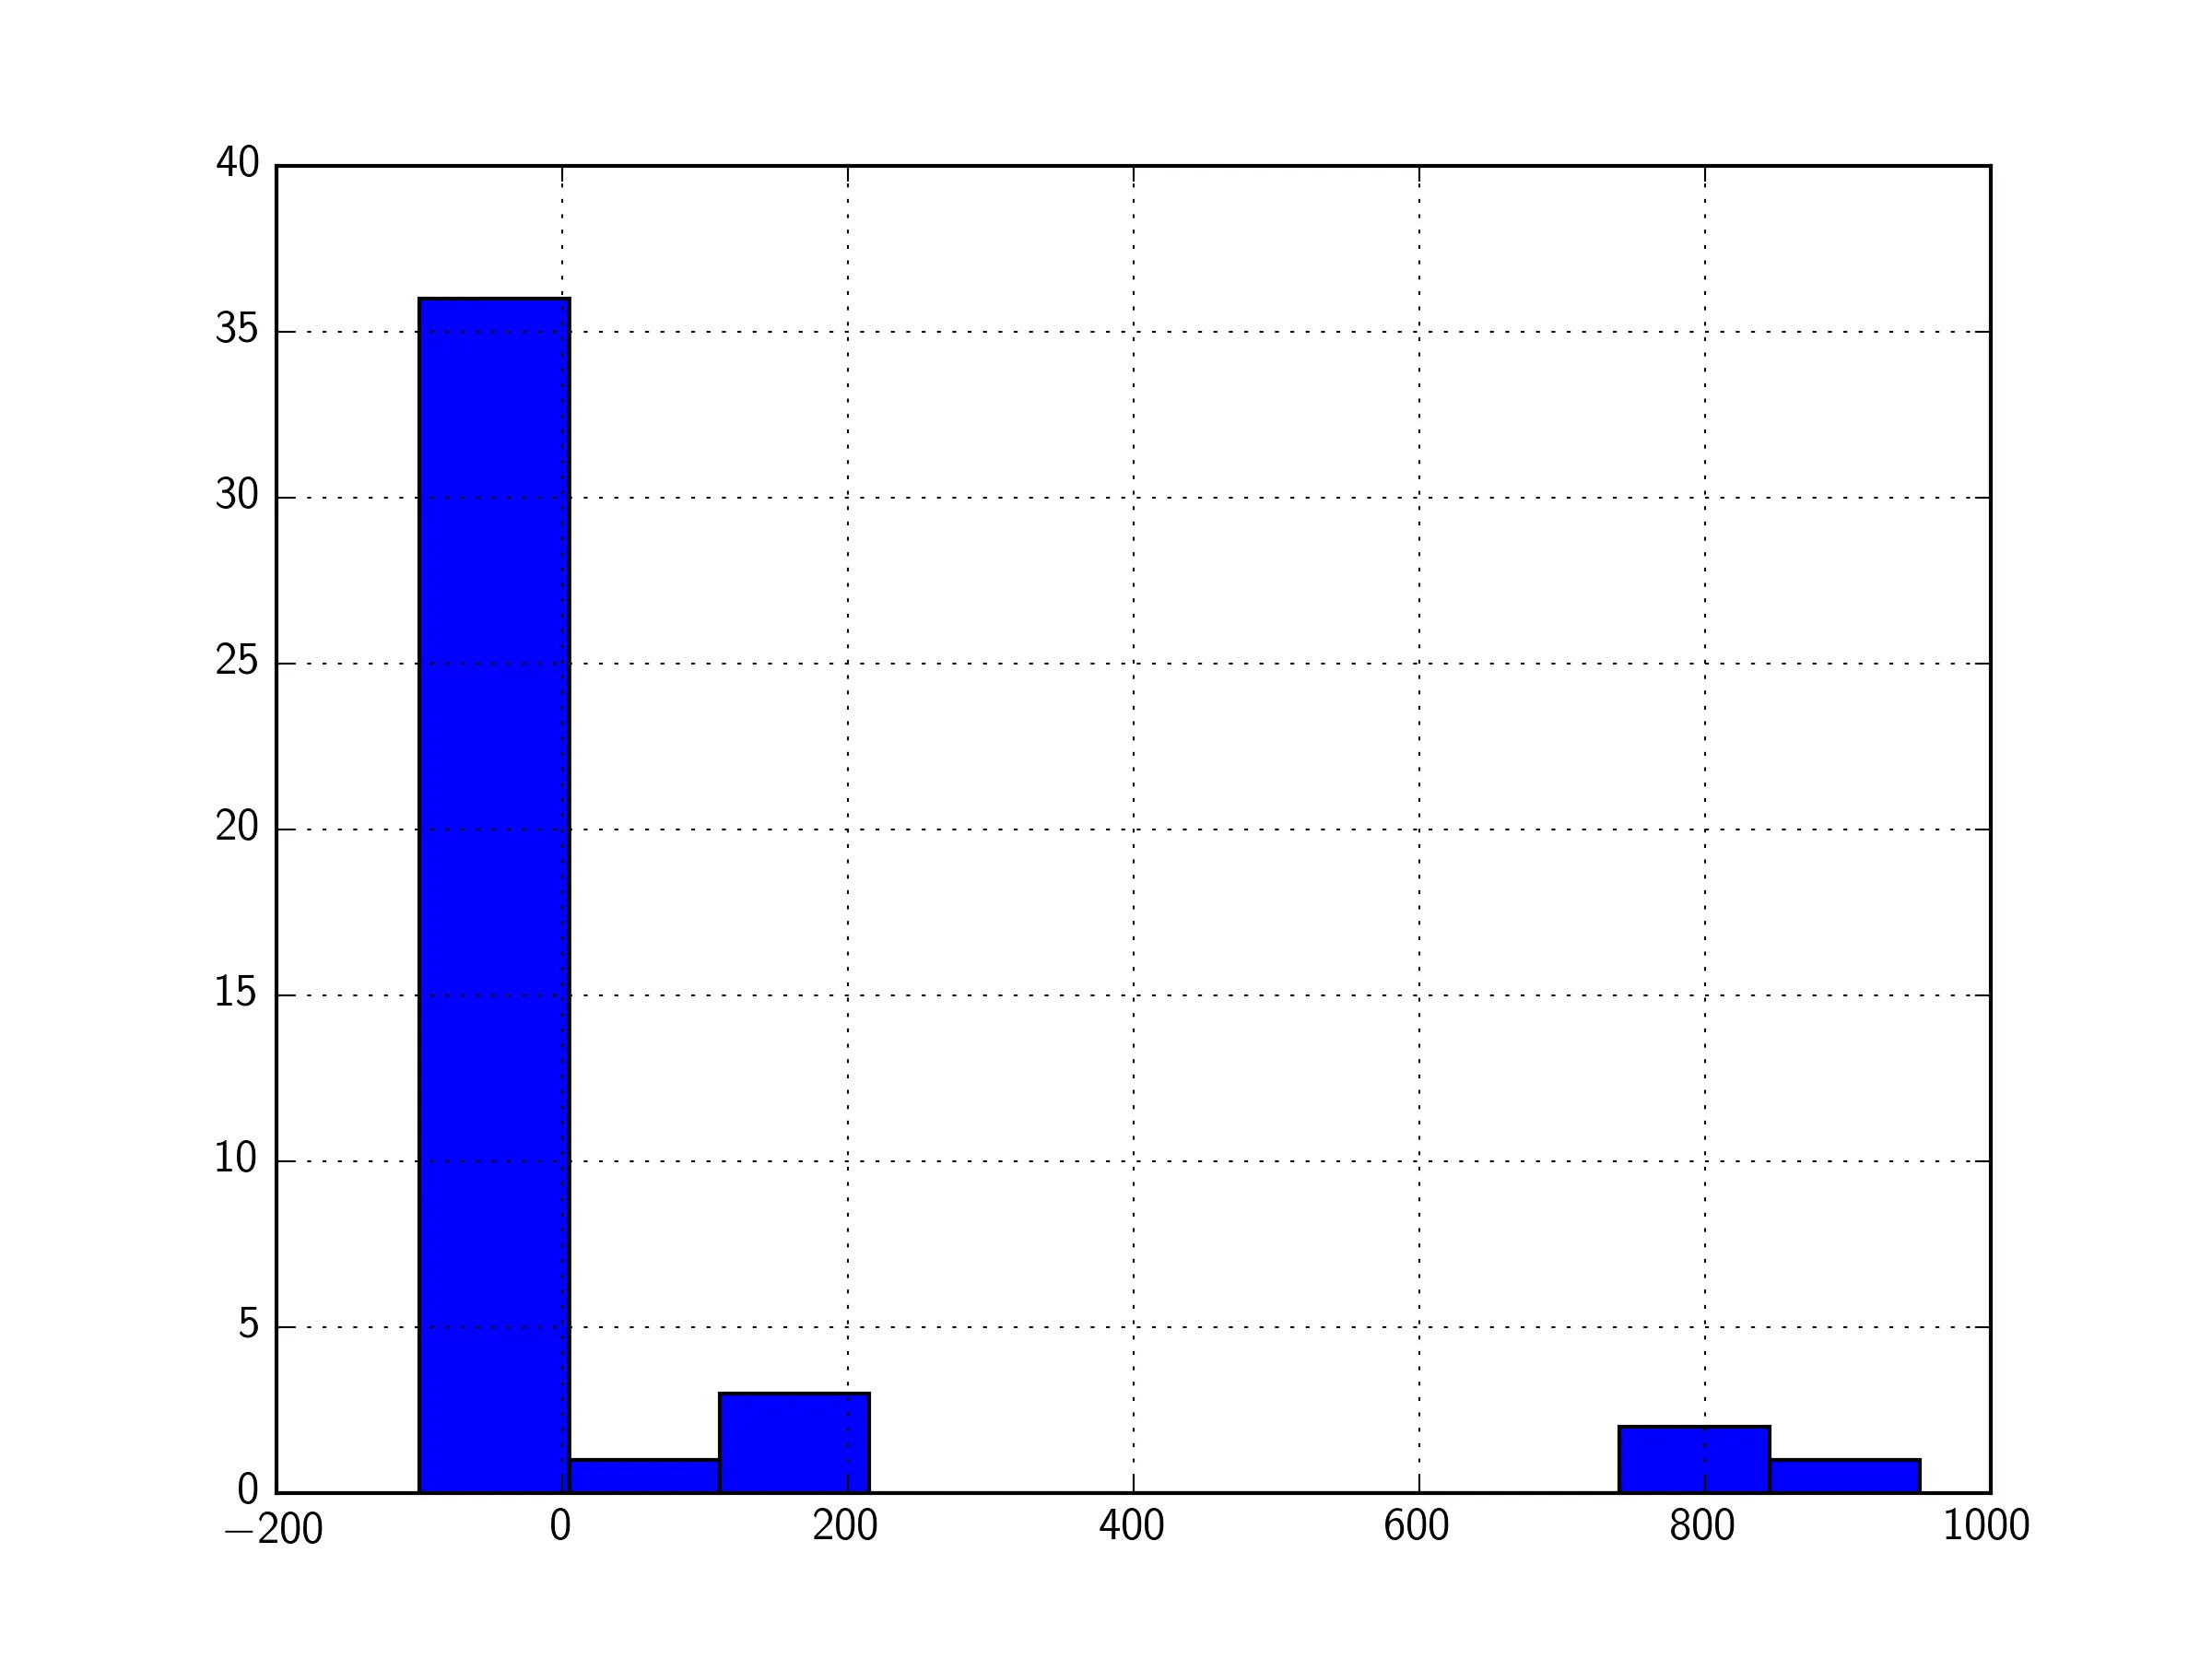
plt.hist进行绘图呢? - xnx
1个回答

13

正如评论中 xnx 所指出的那样,如果您使用 plt.hist,则无法轻松访问此信息。但是,如果您确实想要使用 pandas 的 hist 函数,您可以从调用 serie.hist 时添加到 hist AxesSubplotpatches 中获取此信息。

以下是一个循环遍历补丁并返回bin边缘和直方图计数的函数:

import pandas as pd
import matplotlib.pyplot as plt

serie = pd.Series([0.0,950.0,-70.0,812.0,0.0,-90.0,0.0,0.0,-90.0,0.0,-64.0,208.0,0.0,-90.0,0.0,-80.0,0.0,0.0,-80.0,-48.0,840.0,-100.0,190.0,130.0,-100.0,-100.0,0.0,-50.0,0.0,-100.0,-100.0,0.0,-90.0,0.0,-90.0,-90.0,63.0,-90.0,0.0,0.0,-90.0,-80.0,0.0,])
hist = serie.hist()

def get_hist(ax):
    n,bins = [],[]
    for rect in ax.patches:
        ((x0, y0), (x1, y1)) = rect.get_bbox().get_points()
        n.append(y1-y0)
        bins.append(x0) # left edge of each bin
    bins.append(x1) # also get right edge of last bin

    return n,bins

n, bins = get_hist(hist)

print n
print bins

plt.show()

这里是 nbins 的输出结果:

[36.0, 1.0, 3.0, 0.0, 0.0, 0.0, 0.0, 0.0, 2.0, 1.0]                          # n
[-100.0, 5.0, 110.0, 215.0, 320.0, 425.0, 530.0, 635.0, 740.0, 845.0, 950.0] # bins

这里是直方图,可以进行检查:

输入图片描述


网页内容由stack overflow 提供, 点击上面的
可以查看英文原文,
原文链接