我正在生成两个类似于这样的数组:
[x,y,z] = sphere;
A=[x,y,z]
B=[x+0.5,y+0.5,z+0.5]
第二个数组相对于第一个数组有一个偏移量。
我想找到这两个数组A和B的交集空间。
在这种情况下,我使用了球形函数,但是是否可以针对任意两个数据数组进行操作,而不仅限于球形。有没有办法做到这一点?
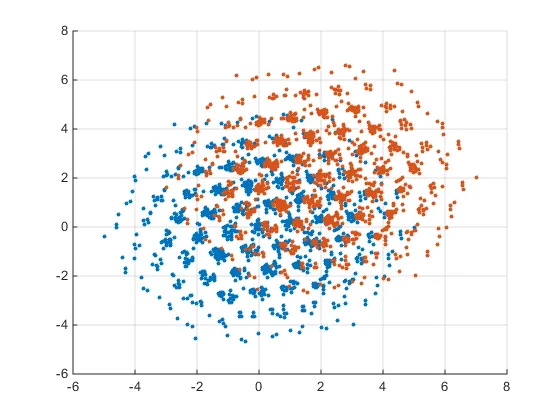
我附加了一张图片,展示我所寻找的内容。我想要找到这两个区域之间的交集。但是你可以看到值不一定相同。
如果我有每个空间限制的方程式,那么问题是否会更容易解决?
我在评论中提到可以使用convhull和inpolygon来解决这个问题,但是inpolygon似乎不适用于3D多边形。我们将使用delaunayTriangulation和pointLocation来得到结果。
[x,y,z] = sphere;
A=[x(:),y(:),z(:)];
B=[x(:)+0.5,y(:)+0.5,z(:)+0.5];

tess1=delaunayTriangulation(A); % delaunay Triangulation of points set A
tess2=delaunayTriangulation(B); % delaunay Triangulation of points set B

Tmp=[A;B];

% Point location searches for the triangles in the given delaunay
% triangulation that contain the points specified in Tmp, here Tmp is
% the reunion of sets A and B and we check for both triangulations
ids1=~isnan(pointLocation(tess1,Tmp));
ids2=~isnan(pointLocation(tess2,Tmp));

% ids1&ids2 is a logical array indicating which points
% in Tmp are in the intersection
IntersectPoints=Tmp(ids1&ids2,:);


plot3(A(:,1),A(:,2),A(:,3),'+b'); hold on
plot3(B(:,1),B(:,2),B(:,3),'+g');
plot3(IntersectPoints(:,1),IntersectPoints(:,2),IntersectPoints(:,3),'*r')
[x,y,z] = sphere;
A=[x(:),y(:)];
B=[x(:)+0.5,y(:)+0.5];

tess1=delaunayTriangulation(A); % delaunay Triangulation of points set A
tess2=delaunayTriangulation(B); % delaunay Triangulation of points set B

Tmp=[A;B];

% Point location searches for the triangles in the given delaunay
% triangulation that contain the points specified in Tmp, here Tmp is
% the reunion of sets A and B and we check for both triangulations
ids1=~isnan(pointLocation(tess1,Tmp));
ids2=~isnan(pointLocation(tess2,Tmp));

% ids1&ids2 is a logical array indicating which points
% in Tmp are in the intersection
IntersectPoints=Tmp(ids1&ids2,:);


plot(A(:,1),A(:,2),'+b'); hold on
plot(B(:,1),B(:,2),'+g');
plot(IntersectPoints(:,1),IntersectPoints(:,2),'*r');
如果您希望您的代码可以自动适应2D或3D数组,则只需要修改绘图调用。只需编写一个if语句来检查A和B中的列数即可。
convhull函数,然后使用inpolygon函数来检查交集中的点。 - BillBokeey