我正在尝试在Matlab中模拟目标的移动,该目标的初始x和y坐标、真实方位角和速度(以m/s表示)已经指定。我想知道是否有一种方法可以简单地绘制一条直线,以指定方位角展示目标所采取的路径(如下图所示)。谢谢!
2个回答
2
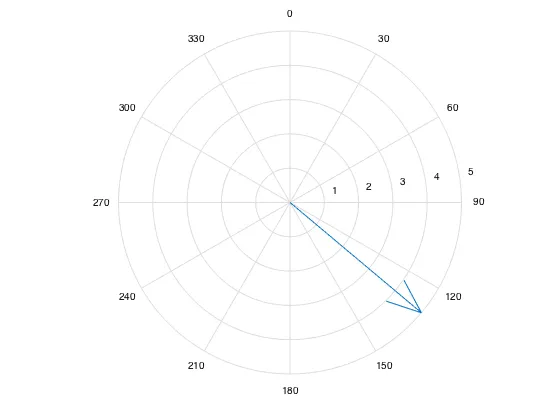
您最好依靠内置的极坐标绘图函数来完成此操作。我认为最符合您需求的是compass。它基本上会在极坐标图上绘制一个箭头,从中心指向笛卡尔坐标系中的一个点。
theta = deg2rad(130);

% Your speed in m/s
speed = 5;

hax = axes();
c = compass(hax, speed * cos(theta), speed * sin(theta));

% Change the view to orient the axes the way you've drawn
view([90 -90])
然后,要更改方向和速度,只需再次调用compass函数,并输入您的新方向/速度即可。
new_theta = deg2rad(new_angle_degrees);
c = compass(hax, new_speed * cos(new_theta), new_speed * sin(new_theta));
其他极坐标绘图选项包括
polar和polarplot,它们接受极坐标但没有箭头。如果您不喜欢极坐标图,可以在笛卡尔坐标轴上使用quiver(确保指定相同的坐标轴)。
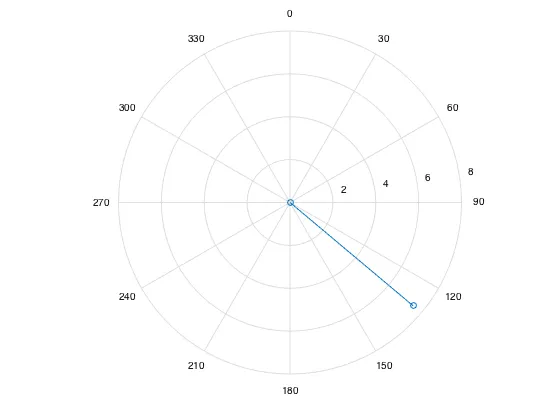
编辑
根据您的反馈和请求,以下是一个距离旅行的极坐标图示例。% Speed in m/s
speed = 5;
% Time in seconds
time = 1.5;
% Bearing in degrees
theta = 130;
hax = axes();
% Specify polar line from origin (0,0) to target position (bearing, distance)
hpolar = polar(hax, [0 deg2rad(theta)], [0 speed * time], '-o');
% Ensure the axis looks as you mentioned in your question
view([90 -90]);
现在,如果您想使用新的方位、速度和时间更新此图表,只需再次调用polar并指定坐标轴即可。
hpolar = polar(hax, [0 theta], [0 speed], '-o');
- Suever
8
0
我不确定我是否理解正确,这是我的解决方案:
figure;hold on; % Create figure
x_start = 10;% Starting position
y_start = 20;
plot(x_start+[-1 1],[y_start y_start],'k');% Plot crosshairs
plot([x_start x_start],y_start+[-1 1],'k');
angle = -(130-90)*pi/180; % Bearing angle 130° like in your graph
x_target = x_start+10*cos(angle); % Calculation of target position
y_target = y_start+10*sin(angle);
plot(x_target+[-1 1],[y_target y_target],'k');% Plot crosshairs
plot([x_target x_target],y_target+[-1 1],'k');
% Draw line between start and target
plot([x_start x_target],[y_start y_target],'g');
set(gca,'xlim',[0 30],'ylim',[0 30]); % Adjust axes
text(x_start+1,y_start,'Start'); % Write text to points
text(x_target+1,y_target,'End');
- Sebastian
6
谢谢你的帮助Sebastian。我对Matlab还是个新手,所以你能详细解释一下在绘制十字线语句中如何操作x_start和y_start变量吗?此外,如果我将方位角改为120度,我注意到结束位置在(5,20),这意味着物体移动的方向与预期相反。有没有办法修复这个问题? - Bilal Hussain
@BilalHussain 我已经修改了你的角度定义答案。十字准星语句没有什么特别的。我只是画了两条线。如果你将[-1 1]添加到数值10上,Matlab会创建一个向量[9 11]。因此x_start+[-1 1]会创建[9 11],[y_start y_start]会创建[20 20]。在绘图命令中,重要的是你有x和y方向上的起始和结束位置。 - Sebastian
请翻译下面与编程有关的内容,从英文到中文。仅返回翻译后的文本:如果问题得到了回答,请确认已回答问题。 - Sebastian
@BilalHussain,关于这个问题,我建议不要采用这种方法,因为它会生成大量的绘图对象,难以管理(并使用不同的参数进行更新)。建议依赖提供相同功能的内置函数。 - Suever
@Suever 如果你声称有一个内置函数可以用较少的绘图对象得到与他帖子中相同的图片,那么你必须展示它。我认为他不仅仅想要指南针图中的方向。 - Sebastian
感谢你的帮助,Sebastian。你的代码现在似乎对于任何方位角都能完美运行。但是,是否可以修改代码以便描绘目标在特定时间段内所经过的路径呢?假设目标的速度为200米/秒,方位角为130度。我想看到10秒后目标的位置。以下for循环是否适用于观察上述情况:
for n=1:10
x_target = x_start+10ncos(angle); % 计算目标位置
y_target = y_start+10nsin(angle);
end - Bilal Hussain
网页内容由stack overflow 提供, 点击上面的可以查看英文原文,
原文链接
原文链接
polar,您可以像使用plot一样绘制任何内容,只不过您使用的是极坐标而不是笛卡尔坐标。 - Suever