我有两个城市之间的美国贸易数据。我有关于城市(节点)和贸易(边缘)的属性数据。
考虑以下图表:
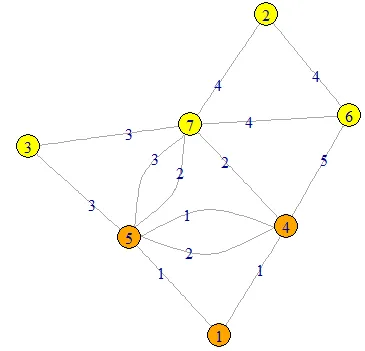
library(igraph)
gg <- graph.atlas(711)
V(gg)$name <- 1:7
V(gg)$city <- c("BOISE","NEW YORK","NEW YORK","BOISE","BOISE","LA","LA")
V(gg)$color <- ifelse(V(gg)$city=="BOISE", "orange","yellow")
gg <- delete.edges(gg, E(gg,P=c(1,2,2,3,2,7,7,6,7,3,3,4,3,5,4,5,5,6,6,1)))
gg <- add.edges(gg,c(1,4,4,5,5,1),attr=list(trade=1))
gg <- add.edges(gg,c(7,5,5,4,4,7),attr=list(trade=2))
gg <- add.edges(gg,c(7,3,3,5,5,7),attr=list(trade=3))
gg <- add.edges(gg,c(2,7,7,6,6,2),attr=list(trade=4))
gg <- add.edges(gg,c(6,4),attr=list(trade=5))
plot(gg, edge.label=E(gg)$trade)
生成以下内容:
例如:
[CITY 1], [CITY 2], [TRADE]
有什么方法可以帮我完成这个任务吗?看起来很简单,但我真的卡住了。