我太习惯在ggplot2中做这个了,所以我很难想象如何在R基础图形中指定alpha值,而plot()中的col =参数用于为分类变量分配颜色类型。
使用鸢尾花数据集(虽然在这种情况下更改alpha值没有什么意义)
data(iris)
library(ggplot2)
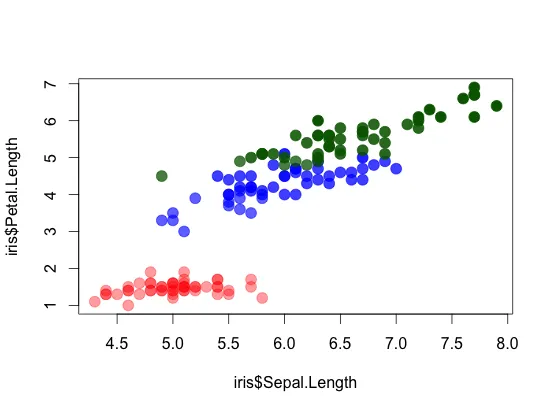
g <- ggplot(iris, aes(Sepal.Length, Petal.Length)) + geom_point(aes(colour=Species), alpha=0.5) #desired plot
plot(iris$Sepal.Length, iris$Petal.Length, col=iris$Species) #attempt in base graphics
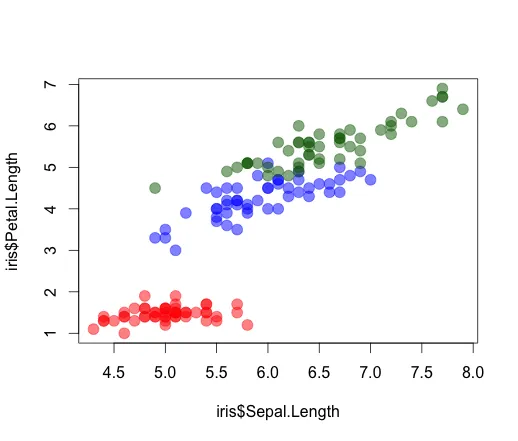
你可以使用{graphics}将另一个变量映射到alpha值上。 例如,在ggplot2中:
g2 <- ggplot(iris, aes(Sepal.Length, Petal.Length)) + geom_point(aes(colour=Species, alpha=Petal.Width))
非常感谢您的帮助!