检查 Kubernetes Pod 的 CPU 和内存利用率

199

我正在尝试查看一个 Kubernetes Pod 使用了多少内存和 CPU。我运行了以下命令:

kubectl top pod podname --namespace=default

我遇到了以下错误:
W0205 15:14:47.248366    2767 top_pod.go:190] Metrics not available for pod default/podname, age: 190h57m1.248339485s
error: Metrics not available for pod default/podname, age: 190h57m1.248339485s

1. 对于这个错误,我该怎么办?有没有其他方法可以获取 Pod 的 CPU 和内存使用情况? 2. 我看到这个命令的示例输出显示 CPU 为 250m。这应该如何解释? 3. 如果我们进入 Pod 并运行 Linux 的 top 命令,会得到相同的输出吗?

5
如果你在pod内运行top命令,它就像在主机系统上运行一样,因为该pod正在使用主机系统的内核。 - Alex Punnen
19个回答

3

要检查 Kubernetes 中单个 Pod 的使用情况,请在终端中键入以下命令:

$ docker ps | grep <pod_name>

这将为您提供 Kubernetes 中正在运行的容器列表。 要检查 CPU 和内存利用率,请使用以下命令:

$ docker stats <container_id>

CONTAINER_ID  NAME   CPU%   MEM   USAGE/LIMIT   MEM%   NET_I/O   BLOCK_I/O   PIDS

我们可以看到Mem USAGE/LIMIT,那么我们也能看到CPU Limit吗?有什么想法吗? - Prashant Pathak
是的,它将显示内存和CPU使用情况。 - Ambir

2

您需要部署Heapster或Metric Server才能查看Pod的CPU和内存使用情况。


2
在我的使用案例中,我想要按命名空间聚合内存/CPU的使用情况,因为我想要看到在我的小型K3s集群中运行的Harbor系统是多么“重”或“轻”,所以我使用kubernetes Python客户端编写了这个Python脚本:
from kubernetes import client, config
import matplotlib.pyplot as plt
import pandas as pd

def cpu_n(cpu_str: str):
    if cpu_str == "0":
        return 0.0
    assert cpu_str.endswith("n")
    return float(cpu_str[:-1])

def mem_Mi(mem_str: str):
    if mem_str == "0":
        return 0.0
    assert mem_str.endswith("Ki") or mem_str.endswith("Mi")
    val = float(mem_str[:-2])
    if mem_str.endswith("Ki"):
        return val / 1024.0
    if mem_str.endswith("Mi"):
        return val

config.load_kube_config()
api = client.CustomObjectsApi()
v1 = client.CoreV1Api()
cpu_usage_pct = {}
mem_usage_mb = {}
namespaces = [item.metadata.name for item in v1.list_namespace().items]
for ns in namespaces:
    resource = api.list_namespaced_custom_object(group="metrics.k8s.io", version="v1beta1", namespace=ns, plural="pods")
    cpu_total_n = 0.0
    mem_total_Mi = 0.0
    for pod in resource["items"]:
        for container in pod["containers"]:
            usage = container["usage"]
            cpu_total_n += cpu_n(usage["cpu"])
            mem_total_Mi += mem_Mi(usage["memory"])
    if mem_total_Mi > 0:
        mem_usage_mb[ns] = mem_total_Mi
    if cpu_total_n > 0:
        cpu_usage_pct[ns] = cpu_total_n * 100 / 10**9

df_mem = pd.DataFrame({"ns": mem_usage_mb.keys(), "memory_mbi": mem_usage_mb.values()})
df_mem.sort_values("memory_mbi", inplace=True)

_, [ax1, ax2] = plt.subplots(2, 1, figsize=(12, 12))

ax1.barh("ns", "memory_mbi", data=df_mem)
ax1.set_ylabel("Namespace", size=14)
ax1.set_xlabel("Memory Usage [MBi]", size=14)
total_memory_used_Mi = round(sum(mem_usage_mb.values()))
ax1.set_title(f"Memory usage by namespace [{total_memory_used_Mi}Mi total]", size=16)

df_cpu = pd.DataFrame({"ns": cpu_usage_pct.keys(), "cpu_pct": cpu_usage_pct.values()})
df_cpu.sort_values("cpu_pct", inplace=True)
ax2.barh("ns", "cpu_pct", data=df_cpu)
ax2.set_ylabel("Namespace", size=14)
ax2.set_xlabel("CPU Usage [%]", size=14)
total_cpu_usage_pct = round(sum(cpu_usage_pct.values()))
ax2.set_title(f"CPU usage by namespace [{total_cpu_usage_pct}% total]", size=16)

plt.show()

示例输出如下:

每个命名空间的内存CPU使用情况

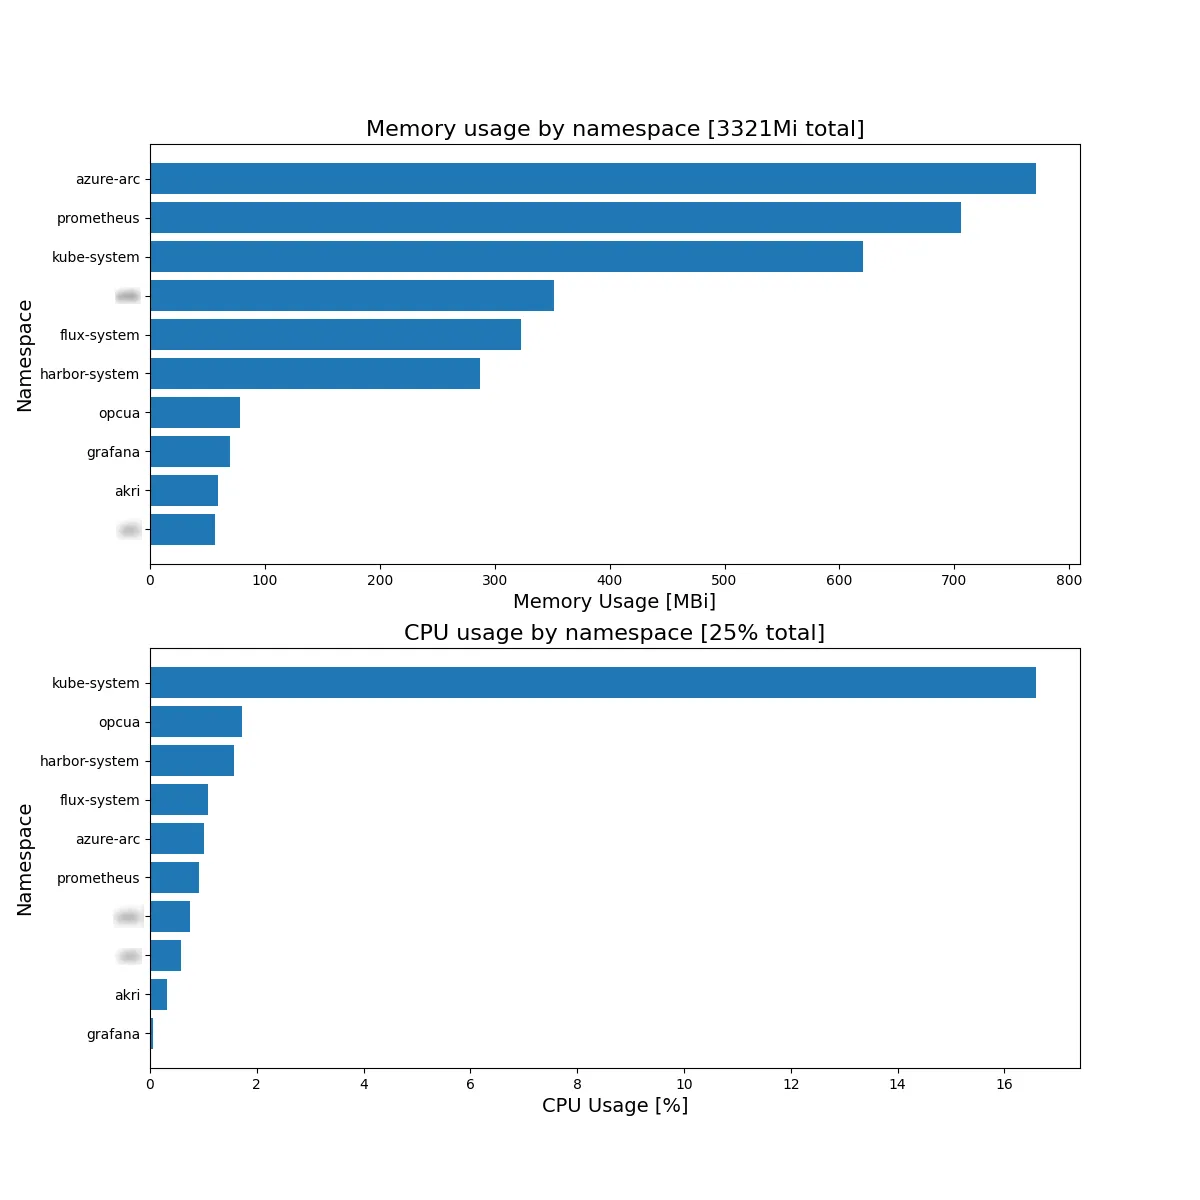
当然,请记住这只是系统内存和CPU使用情况的快照,随着工作负载的活跃程度的增加或减少,它可能会有很大变化。


1
您可以按照这里定义的API进行使用:
例如:
kubectl -n default get --raw /apis/metrics.k8s.io/v1beta1/namespaces/default/pods/nginx-7fb5bc5df-b6pzh | jq

{
  "kind": "PodMetrics",
  "apiVersion": "metrics.k8s.io/v1beta1",
  "metadata": {
    "name": "nginx-7fb5bc5df-b6pzh",
    "namespace": "default",
    "selfLink": "/apis/metrics.k8s.io/v1beta1/namespaces/default/pods/nginx-7fb5bc5df-b6pzh",
    "creationTimestamp": "2021-06-14T07:54:31Z"
  },
  "timestamp": "2021-06-14T07:53:54Z",
  "window": "30s",
  "containers": [
    {
      "name": "nginx",
      "usage": {
        "cpu": "33239n",
        "memory": "13148Ki"
      }
    },
    {
      "name": "git-repo-syncer",
      "usage": {
        "cpu": "0",
        "memory": "6204Ki"
      }
    }
  ]
}

nginx-7fb5bc5df-b6pzh 是 Pod 的名称。

注意,CPU 是以纳秒为单位进行测量的,其中 1x10E9 纳秒 = 1 CPU。


当没有可用的度量衡时,这将无法工作。 - hrbdg

1

我知道这是一个旧帖子,但我刚找到它,试图做类似的事情。最终我发现我可以使用Visual Studio Code Kubernetes插件。这是我所做的:

  • 选择集群并打开工作负载/ Pod部分,在其中找到您想要监视的Pod(您可以通过工作负载部分中的任何其他分组来访问Pod)
  • 右键单击Pod并选择“终端”
  • 现在,您可以使用“top”命令实时监视CPU和内存,或者查看上述文件的内容。

希望能对您有所帮助。


1
完成 Dashrath Mundkar 的回答,可以在不进入 Pod(使用命令提示符)的情况下执行以下操作: kubectl exec pod_name -n namespace -- cat /sys/fs/cgroup/cpu/cpuacct.usage

0

如果你正在使用 minikube,你可以启用 metrics-server 插件;这样将在仪表盘上显示相关信息。


0
如果您使用 sh 或 bash 进入您的 pod,您可以运行 top 命令,该命令将提供一些关于资源利用情况的统计信息,每隔几秒钟更新一次。

enter image description here


我遇到了错误 bash: top: command not found - Alexey Sh.
你可能需要使用你的软件包管理器来安装它。 - Ian Robertson
1
通常使用从“scratch”镜像创建的图像的Pods没有安装“top”。 - drFunJohn
2
仅供参考,此方法不会给出特定 Pod 的独立统计信息,它将显示集群的统计信息。 - uajov6
如果您在运行的容器中执行,则使用该容器的 shell。我们没有通过 kubectl 运行 top,因此它不是基于集群的。 - Ian Robertson
显示剩余2条评论

0

仅当度量服务器已启用或已配置第三方解决方案(如Prometheus)时,才可使用指标。否则,您需要查看/sys/fs/cgroup/cpu/cpuacct.usage以获取CPU使用情况,这是此cgroup/container占用的总CPU时间,以及/sys/fs/cgroup/memory/memory.usage_in_bytes以获取内存使用情况,这是cgroup/container中所有进程消耗的总内存。

还有一个名为QOS的野兽,它可以具有Bursted、Guaranteed等值。如果您的Pod出现了Bursted,则即使未超过CPU或内存阈值,它也将被OOMKilled。

Kubernetes很有趣!!!


网页内容由stack overflow 提供, 点击上面的
可以查看英文原文,
原文链接