7个回答
23
我尝试了Gepeto的解决方案,但由于颜色差异可能仅是偶然的相似,因此它有很多误报。正确的方法是计算每个像素的方差。首先将图像缩小,以便不必处理数百万个像素。
默认情况下,此函数还使用平均颜色偏差调整,我发现这可以提高预测的准确性。这样做的一个副作用是它也会检测到单色但非灰度图像(通常是棕褐色调的东西,模型在检测与灰度更大的偏差时似乎会出现一些问题)。您可以通过对颜色带均值进行阈值处理来将这些分离出真正的灰度图像。
我在一个包含13,000张摄影图像的测试集上运行了此代码,并获得了99.1%的精度和92.5%的召回率的分类结果。通过使用非线性偏差调整(例如,颜色值必须介于0和255之间),可能可以进一步提高准确性。也许查看中位数平方误差而不是MSE会更好地允许具有小颜色标记的灰度图像。
默认情况下,此函数还使用平均颜色偏差调整,我发现这可以提高预测的准确性。这样做的一个副作用是它也会检测到单色但非灰度图像(通常是棕褐色调的东西,模型在检测与灰度更大的偏差时似乎会出现一些问题)。您可以通过对颜色带均值进行阈值处理来将这些分离出真正的灰度图像。
我在一个包含13,000张摄影图像的测试集上运行了此代码,并获得了99.1%的精度和92.5%的召回率的分类结果。通过使用非线性偏差调整(例如,颜色值必须介于0和255之间),可能可以进一步提高准确性。也许查看中位数平方误差而不是MSE会更好地允许具有小颜色标记的灰度图像。
from PIL import Image, ImageStat
def detect_color_image(file, thumb_size=40, MSE_cutoff=22, adjust_color_bias=True):
    pil_img = Image.open(file)
    bands = pil_img.getbands()
    if bands == ('R','G','B') or bands== ('R','G','B','A'):
        thumb = pil_img.resize((thumb_size,thumb_size))
        SSE, bias = 0, [0,0,0]
        if adjust_color_bias:
            bias = ImageStat.Stat(thumb).mean[:3]
            bias = [b - sum(bias)/3 for b in bias ]
        for pixel in thumb.getdata():
            mu = sum(pixel)/3
            SSE += sum((pixel[i] - mu - bias[i])*(pixel[i] - mu - bias[i]) for i in [0,1,2])
        MSE = float(SSE)/(thumb_size*thumb_size)
        if MSE <= MSE_cutoff:
            print "grayscale\t",
        else:
            print "Color\t\t\t",
        print "( MSE=",MSE,")"
    elif len(bands)==1:
        print "Black and white", bands
    else:
        print "Don't know...", bands
- Noah Whitman
2
2嗨,谢谢你。我正在尝试弄清楚这是如何工作的。 "MSE","SSE"是什么意思?你能链接一些文档吗? - Rich Tier
SSE/MSE是均方误差/平均平方误差。回顾一下,如果你将其转换为HSV或类似的颜色空间,这个概念可能会更容易理解。然后,SSE仅在色调/饱和度通道中计算与零的差异或偏差(如果有)。 - Noah Whitman
11
我们使用这个简单的函数来确定图像的颜色因子。
# Iterate over all Pixels in the image (width * height times) and do this for every pixel:
{
    int rg = Math.abs(r - g);
    int rb = Math.abs(r - b);
    int gb = Math.abs(g - b);
    diff += rg + rb + gb;
}

return diff / (height * width) / (255f * 3f);
对于灰度图像,由于灰度值的 r-g = 0、r-b = 0 和 g-b = 0,因此差异值将接近于 0;对于彩色图像,差异值将大于 0。
- TomB
4
我已经找到了一个方法,可以使用 PIL.ImageStat 模块来猜测。感谢 这篇文章,对于图像单色的确定。
from PIL import Image, ImageStat

MONOCHROMATIC_MAX_VARIANCE = 0.005
COLOR = 1000
MAYBE_COLOR = 100

def detect_color_image(file):
    v = ImageStat.Stat(Image.open(file)).var
    is_monochromatic = reduce(lambda x, y: x and y < MONOCHROMATIC_MAX_VARIANCE, v, True)
    print file, '-->\t',
    if is_monochromatic:
        print "Monochromatic image",
    else:
        if len(v)==3:
            maxmin = abs(max(v) - min(v))
            if maxmin > COLOR:
                print "Color\t\t\t",
            elif maxmin > MAYBE_COLOR:
                print "Maybe color\t",
            else:
                print "grayscale\t\t",
            print "(",maxmin,")"
        elif len(v)==1:
            print "Black and white"
        else:
            print "Don't know..."
COLOR 和 MAYBE_COLOR 常量是快速切换查找彩色和灰度图像之间差异的方法,但这不安全。例如,我有几个JPEG图像,虽然看起来是彩色的,但实际上是灰度的,并且由于扫描过程中的一些颜色伪像而带有一些颜色元素。这就是为什么我需要另一种方法来确定真正的彩色图像和其他图像之间的区别。 < / p>
< p > 如果有更好的方法,请告诉我。 < / p>
- Gepeto
1
我个人更喜欢TomB的答案。这不是一个新答案,我只是想发布Java版本:
private Mat calculateChannelDifference(Mat mat) {

    // Create channel list:
    List<Mat> channels = new ArrayList<>();

    for (int i = 0; i < 3; i++) {
        channels.add(new Mat());
    }

    // Split the channels of the input matrix:
    Core.split(mat, channels);

    Mat temp = new Mat();

    Mat result = Mat.zeros(mat.size(), CvType.CV_8UC1);

    for (int i = 0; i < channels.size(); i++) {

        // Calculate difference between 2 successive channels:
        Core.absdiff(channels.get(i), channels.get((i + 1) % channels.size()), temp);

        // Add the difference to the result:
        Core.add(temp, result, result);
    }

    return result;
}
结果是一个矩阵,这样你就可以应用一些阈值,甚至检测形状。如果你想要单个数字的结果,只需计算平均值即可。可以使用
Core.mean()来完成。- Tim
1
问题在于,每个像素上没有绝对计算。正负两侧的差异会相互抵消,导致错误的结果。 - TomB
1
import numpy as np
import cv2
import imutils


def image_colorfulness(image):
    (B, G, R) = cv2.split(image.astype("float"))
    rg = np.absolute(R - G)
    yb = np.absolute(0.5 * (R + G) - B)
    (rbMean, rbStd) = (np.mean(rg), np.std(rg))
    (ybMean, ybStd) = (np.mean(yb), np.std(yb))
    stdRoot = np.sqrt((rbStd ** 2) + (ybStd ** 2))
    meanRoot = np.sqrt((rbMean ** 2) + (ybMean ** 2))
    return stdRoot + (0.3 * meanRoot)


image = cv2.imread('green.JPG')
image = imutils.resize(image, width=250)
C  = image_colorfulness(image)
#set a threshold
print(C)
if C > 10:
    print('its a color image...')
elif 8 < C <= 10:
    print('Not Sure...')
else:
    print('Black and white image...')
cv2.putText(image, "{:.2f}".format(C), (40, 40), cv2.FONT_HERSHEY_SIMPLEX, 1.4, (0, 255, 0), 3)

cv2.imshow('im',image)
cv2.waitKey(0)
- SOUVIK SAHA
1
https://pyimagesearch.com/2017/06/05/computing-image-colorfulness-with-opencv-and-python/ - SOUVIK SAHA
1
这种解决方案是受到TomB的帖子启发的,有一点变化。 Tom的帖子基于RGB颜色空间,而我的基于LAB颜色空间。要了解有关LAB空间的更多信息,请阅读此帖子以及其中提到的链接。
使用LAB空间的优点
LAB和RGB一样具有3个通道。 但是只有2个通道具有颜色信息(A和B),而L通道表示亮度值。与必须分析所有三个通道的RGB不同,使用LAB,我们可以仅分析2个通道。 当需要分析大量图像时,此方法将受益良多。
方法:
该方法与Tom的帖子没有区别。 这里我们将:
- 获取图像的A和B通道
- 找到它们之间差异的平均值
- 确定一个阈值,高于该阈值,则可以将所有图像标记为彩色。
代码
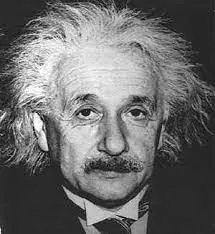
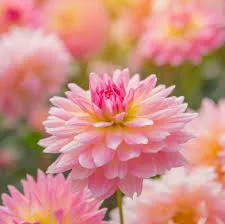
使用的图像:
灰度图像:
彩色图像:
einstein_img = cv2.imread('Einstein.jpg')
flower_img = cv2.imread('flower.jpg')

# convert to LAB space
elab = cv2.cvtColor(einstein_img, cv2.COLOR_BGR2LAB)
flab = cv2.cvtColor(flower_img, cv2.COLOR_BGR2LAB)

# split the channels
el, ea, eb = cv2.split(elab)
# obtain difference between A and B channel at every pixel location
de = abs(ea-eb)
# find the mean of this difference
mean_e = np.mean(de)

# same as above for the color image:
fl, fa, fb = cv2.split(flab)
df = abs(fa-fb)
mean_f = np.mean(df)

# for gray image
print(mean_e)
0.0
# for color image
print(mean_f)
83.5455
为什么这个工作?
这个方法有效是因为主要由白色、灰色和黑色组成的图像在LAB空间的双色通道中没有显示出太大的变化。它被设计用于很好地分割/隔离主导颜色。但对于少彩色的图像也可以很好地工作。
彩色flower图像的A和B通道并排放置:
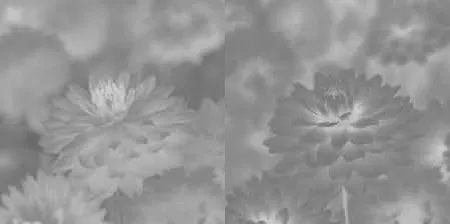
由于每个像素之间存在差异,我们得到了一个非零的平均值。
灰色Einstein图像的A和B通道并排放置:

然而,在这里我们获得了零的平均值。
注意:尽管0是理想的平均值,但在灰度图像中可能会出现非零值的情况。该值不会像彩色图像那样大。在这种情况下,可以定义一个阈值。
- Jeru Luke
-3
你可以使用cv::Mat::channels()运算符,它可以告诉你图像是“灰度”(即2通道)还是“彩色”(即3通道)。对于黑白图像,你需要基于灰度设置更深入的测试,因为定义不同。
- scap3y
2
1感谢scap3y的回答。你在谈论图像结构,但是对于一张RGB JPEG图像(3个通道),它在视觉上看起来像是灰度或黑白图像(因此可以转换为8位JPEG或TIF-Group4)怎么办? - Gepeto
我原本想提供一个解决方案,但我想你已经找到了一个基于PIL的方法,这会对你有所帮助。祝好! - scap3y
网页内容由stack overflow 提供, 点击上面的可以查看英文原文,
原文链接
原文链接