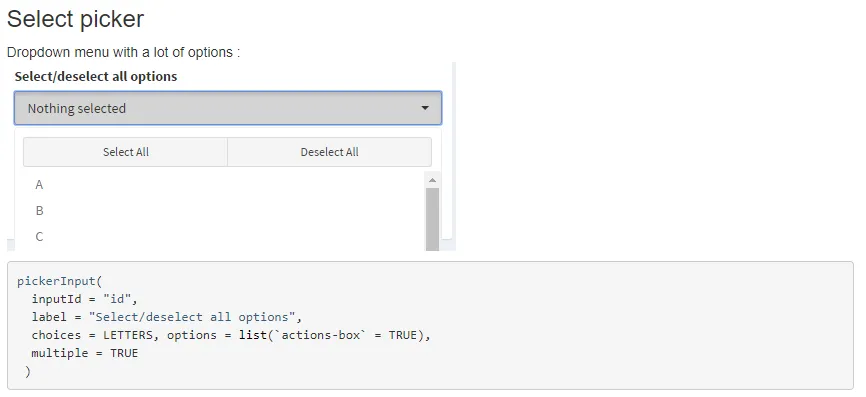
选择/取消选择所有按钮用于闪亮变量选择

11

我有一个语句,可以让我获取关于变量的基本描述性统计信息:

checkboxGroupInput('show_vars', 'Columns in diamonds to show:',
                          names(input_data), selected = names(input_data))

然而,在我不得不取消选中10个变量才能获取我感兴趣的一个变量之后,我意识到这个用户界面并不是很友好。我想添加一个按钮,当你点击它时可以全选/取消所有。它可以被点击多次。我甚至不确定如何开始。任何提示都将有所帮助。

ui.R:

library(shiny)
hw<-diamonds 

shinyUI(fluidPage(
  title = 'Examples of DataTables',
  sidebarLayout(
    sidebarPanel(
        checkboxGroupInput('show_vars', 'Columns in diamonds to show:',
                           names(hw), selected = names(hw))

    ),
    mainPanel(
      verbatimTextOutput("summary"), 
      tabsetPanel(
        id = 'dataset',
        tabPanel('hw', dataTableOutput('mytable1'))
        )
    )
  )
))

服务器.R:

library(shiny)
data(diamonds)
hw<-diamonds  
shinyServer(function(input, output) {
  output$summary <- renderPrint({
    dataset <- hw[, input$show_vars, drop = FALSE]
    summary(dataset)
  })
  # a large table, reative to input$show_vars
  output$mytable1 <- renderDataTable({
    library(ggplot2)
    hw[, input$show_vars, drop = FALSE]
  })
})

请提供您的代码的其余部分 - server.Rui.R以及测试程序所需的任何数据。 - nrussell
HW最初是其他东西,所以我很快为钻石数据集整理了一些内容。 - user3780173
为什么不使用 selectize(multiple = TRUE) 而不是 checkboxGroupInput()?您还将 selected = 设置为 names(...),这就是为什么所有内容都被选中的原因 - 只需将 selected = '' 修复即可。此解决方案无法获得“全部”选项(即使我也在寻找),但对于 ~10 个选择,我认为这是正确的方法。可能是错误的。 - d8aninja
3个回答

14

这是我设置全选/取消全选按钮的方法。

在ui.R中添加一个必要的操作按钮:


actionButton("selectall", label="Select/Deselect all")

然后server.R会根据操作按钮的条件使用updateCheckboxGroupInput。 如果按钮按下的次数是偶数,它将选择全部;否则,如果是奇数,则不选。

# select/deselect all using action button

observe({
  if (input$selectall > 0) {
    if (input$selectall %% 2 == 0){
      updateCheckboxGroupInput(session=session, 
                               inputId="show_vars",
                               choices = list("carat" = "carat",
                                              "cut" = "cut",
                                              "color" = "color",
                                              "clarity"= "clarity",
                                              "depth" = "depth",
                                              "table" = "table",
                                              "price" = "price",
                                              "x" = "x",
                                              "y" = "y",
                                              "z" = "z"),
                               selected = c(names(hw)))

    } else {
      updateCheckboxGroupInput(session=session, 
                               inputId="show_vars",
                               choices = list("carat" = "carat",
                                              "cut" = "cut",
                                              "color" = "color",
                                              "clarity"= "clarity",
                                              "depth" = "depth",
                                              "table" = "table",
                                              "price" = "price",
                                              "x" = "x",
                                              "y" = "y",
                                              "z" = "z"),
                               selected = c())

    }}
})

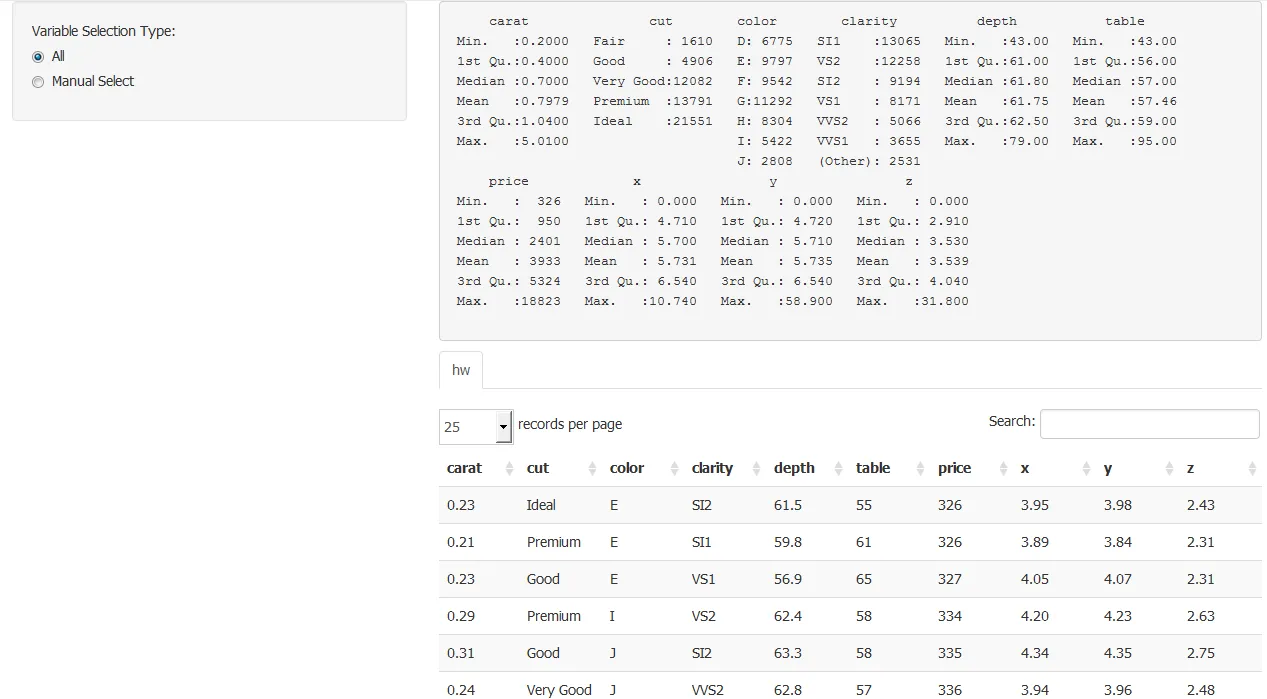
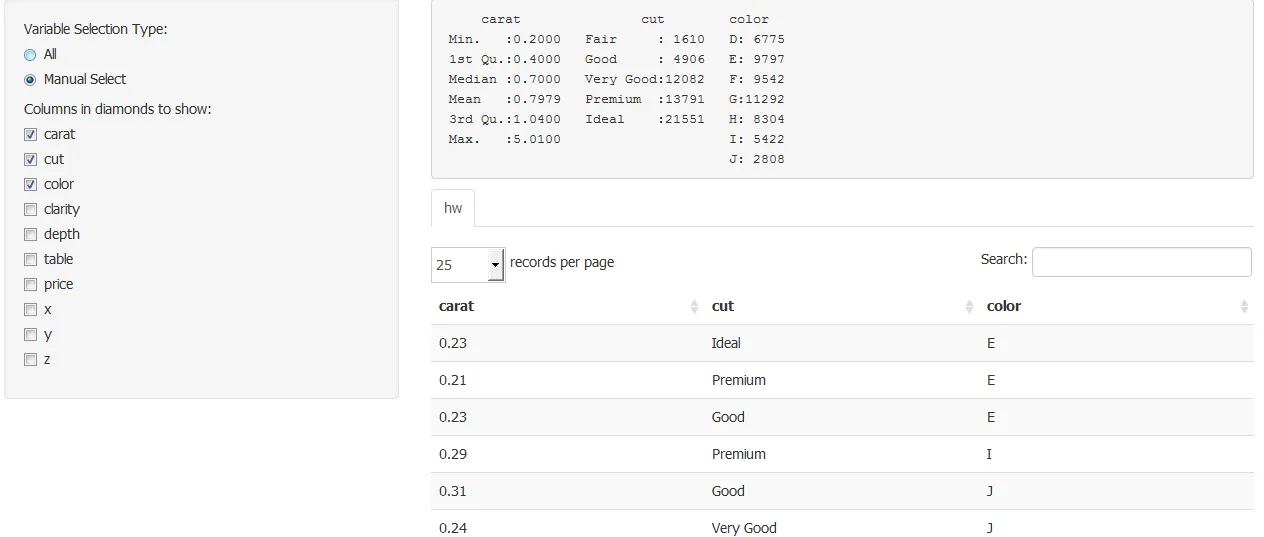
以下是您所示例的完整应用程序 - 您需要将会话添加到服务器函数中,我添加了一个条件,用于在未选择变量时呈现renderDataTable。

library(shiny)
library(ggplot2)
data(diamonds)
hw <- diamonds

runApp(
  list(
    ui=(
      fluidPage(
        title = 'Examples of DataTables',
        sidebarLayout(
          sidebarPanel(
            actionButton("selectall", label="Select/Deselect all"),
            checkboxGroupInput('show_vars', 'Columns in diamonds to show:',
                               names(hw), selected = names(hw))

          ),
          mainPanel(
            verbatimTextOutput("summary"),
            tabsetPanel(
              id = 'dataset',
              tabPanel('hw', dataTableOutput('mytable1'))
            ))))),

    server = (function(input, output, session) {
      output$summary <- renderPrint({
        dataset <- hw[, input$show_vars, drop = FALSE]
        summary(dataset)
      })
      observe({
        if (input$selectall > 0) {
          if (input$selectall %% 2 == 0){
            updateCheckboxGroupInput(session=session, inputId="show_vars",
                                     choices = list("carat" = "carat",
                                                    "cut" = "cut",
                                                    "color" = "color",
                                                    "clarity"= "clarity",
                                                    "depth" = "depth",
                                                    "table" = "table",
                                                    "price" = "price",
                                                    "x" = "x",
                                                    "y" = "y",
                                                    "z" = "z"),
                                     selected = c(names(hw)))

          }
          else {
            updateCheckboxGroupInput(session=session, inputId="show_vars",
                                     choices = list("carat" = "carat",
                                                    "cut" = "cut",
                                                    "color" = "color",
                                                    "clarity"= "clarity",
                                                    "depth" = "depth",
                                                    "table" = "table",
                                                    "price" = "price",
                                                    "x" = "x",
                                                    "y" = "y",
                                                    "z" = "z"),
                                     selected = c())

          }}
      })

      # a large table, reative to input$show_vars
     output$mytable1 <- renderDataTable({
        if (is.null(input$show_vars)){
          data.frame("no variables selected" = c("no variables selected"))
        } else{
          hw[, input$show_vars, drop = FALSE]
        }

      })
    })

  ))

谢谢,这正是我需要的,因为我不想选择“全部”或“无”,而是以“一些”作为默认值。 - Ruben
不确定在shiny中是否有所更改,但截至本评论,selected = ""可用于取消选择所有内容,而selected = c()则无法。 - Nate

14
shinyWidgets库有一个很好的功能叫做pickerInput(),带有“全选/取消全选”功能。经过大量研究,我发现这是唯一内置此功能的Shiny输入框:

enter image description here

链接到网站:https://dreamrs.github.io/shinyWidgets/index.html


10

我添加了一个global.R文件来加载包和数据 - 这并不总是必要的,但通常更加简洁。可能有不同的方法来实现下面我所做的事情,但在这种情况下我倾向于使用有条件的面板。

ui.R

library(shiny)

shinyUI(fluidPage(
  title = 'Examples of DataTables',
  sidebarLayout(
    sidebarPanel(

      radioButtons(
        inputId="radio",
        label="Variable Selection Type:",
        choices=list(
          "All",
          "Manual Select"
        ),
        selected="All"),

      conditionalPanel(
        condition = "input.radio != 'All'",
        checkboxGroupInput(
          'show_vars', 
          'Columns in diamonds to show:',
          choices=names(hw), 
          selected = "carat"
        )
      )

    ),
    mainPanel(
      verbatimTextOutput("summary"), 
      tabsetPanel(
        id = 'dataset',
        tabPanel('hw', dataTableOutput('mytable1'))
      )
    )
  )
))

服务器.R

library(shiny)
library(ggplot2)
##
shinyServer(function(input, output) {

  Data <- reactive({

    if(input$radio == "All"){
      hw
    } else {
      hw[,input$show_vars,drop=FALSE]
    }

  })

  output$summary <- renderPrint({
    ## dataset <- hw[, input$show_vars, drop = FALSE]
    dataset <- Data()
    summary(dataset)
  })

  # a large table, reative to input$show_vars
  output$mytable1 <- renderDataTable({
    Data()
    ## hw[, input$show_vars, drop = FALSE]
  })
})

global.R

library(shiny)
library(ggplot2)
data(diamonds)
hw <- diamonds

这里输入图片描述

这里输入图片描述


这不是我原来想的,但它给了我一个创意去创建一个名为“全选”的按钮,可以转到两个条件面板,一个有所有的选定,另一个则为空。感谢灵感! - user3780173

网页内容由stack overflow 提供, 点击上面的
可以查看英文原文,
原文链接